
Every four years, rugby fans around the globe come together to a chosen nation, with one dream in mind: to see their country lift the Rugby World Cup. 2023 is no different, with France hosting the competition. 48 matches across nine cities, all culminating in September’s epic final at the Stade de France.
So, who can follow in South Africa’s title-winning 2019 campaign and lift the William Webb Ellis trophy in 2023?
Delving into Rugby World Cup statistics, we reveal the top teams and players from tournaments of the past and provide the latest Rugby World Cup facts and stats ahead of the 2023 competition.
Overview of Rugby World Cup statistics 2023
- The 2019 Rugby World Cup generated approximately £4.3 billion in revenue – the highest total of any Rugby World Cup to date.
- The average number of tries per game increased from 5.6 to 6.3 (+12.5%) between the 2015 and 2019 Rugby World Cups.
- New Zealand and South Africa have won the most Rugby World Cups of any other nation, with each country lifting the trophy three times.
- Jonny Wilkinson holds the Rugby World Cup records for the most penalties (58), drop goals (14), and overall points (227) scored at a Rugby World Cup.
- The 2015 Rugby World Cup holds the record for the highest average stadium attendance (51,621).
- The 2019 Rugby World Cup attracted an estimated 857 million viewers worldwide – the highest number to date.
- New Zealand have scored a total of 2,430 points in the Rugby World Cup to date – 40% more than the next-highest team (Australia).
Rugby World Cup history
Since its origins in 1987, the Rugby World Cup has been contested nine times across nine different nations. The tournament, which takes place every four years, began in Australia and New Zealand and has since been held in many European countries, South Africa and, more recently, Japan in 2019.
A map of the location of previous and future hosts of the Rugby World Cup
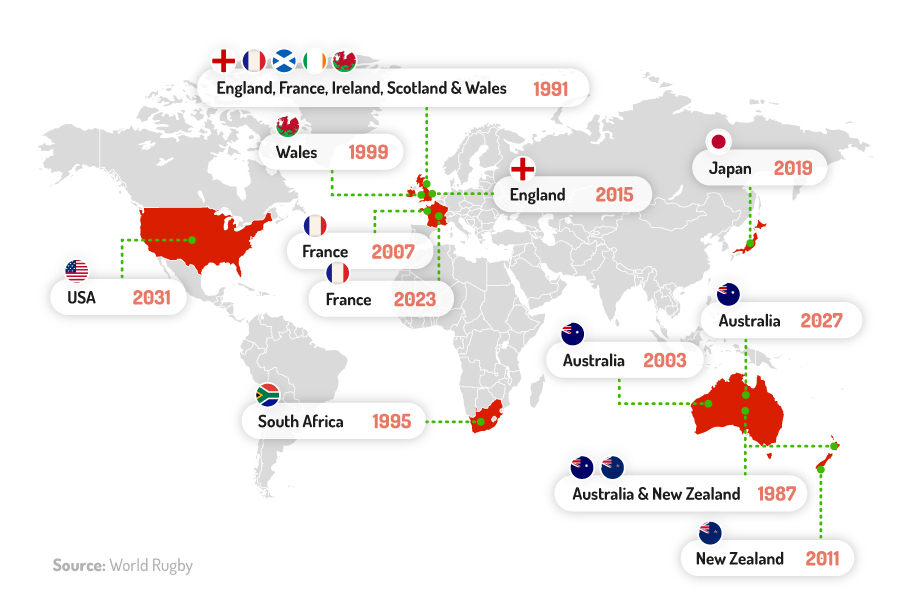
The next Rugby World Cup is due to take place in 2023, with France as the host nation.
How has the Rugby World Cup changed over time?
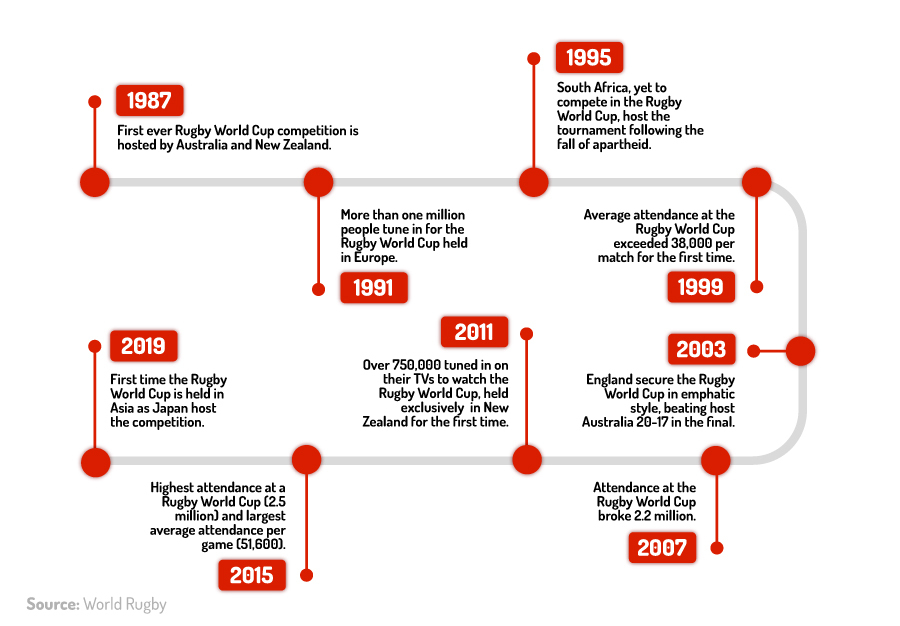
The Rugby World Cup has seen some significant changes since it began in 1987. As the popularity of the competition has grown, this has meant expanding to new corners of the world and competing nations. The rules and format of the competition have also evolved along with the sport into what we see today.
A breakdown of significant events involving the Rugby World Cup between 1987 and 2019
1987 Rugby World Cup
At the time of the 1987 Rugby World Cup, rugby was still an amateur sport using unpaid players. However, after an international vote in which a World Cup concept was created, the first event took place in 1987. Australia and New Zealand played host, with the Kiwis winning the inaugural trophy.
The 1987 Rugby World Cup was deemed a success, generating £1 million in profit through ticket sales, TV rights, and merchandising. Although average attendance was just 15,000 fans per game, the global Rugby World Cup coverage helped boost the sport’s notoriety around the world.

1991 Rugby World Cup
For the 1991 Rugby World Cup, the tournament was jointly hosted by the UK, Ireland, Scotland, Wales, and France. With more than a million spectators across the tournament, this helped solidify the competition’s international reputation.
Australia took home the William Webb Ellis trophy after beating England 12-6 in the Twickenham Stadium finale. Remarkably, according to ITV, around 13.6 million viewers watched the final in the UK alone.

1995 Rugby World Cup
In 1995, the International Rugby Football Board (IRFB) took the controversial decision to host the tournament in South Africa. Apartheid had only ended here a year earlier (in 1994), and South Africa was yet to compete in a Rugby World Cup.
However, while overall turnout peaked at just 938,000, millions across the globe tuned in to watch Nelson Mandela hand the trophy to winners South Africa, with the Springboks having beaten rivals New Zealand 15-12 in the final.
1999 Rugby World Cup
Match attendance increased further in the 1999 Rugby World Cup, exceeding 1.5 million spectators for the first time. The popularity of the competition was rapidly increasing. Average turnout at matches now exceeded 38,000 per game for the first time in the tournament’s history. Australia were once again crowned winners, beating France 35-12.
2003 Rugby World Cup
2003 saw Australia as host, with the reigning champions using the 2002 Sydney Olympic infrastructure to good effect. Attendance for the competition was over 1.8 million people, with an average match turnout of over 38,200 people. England won their first Rugby World Cup trophy in 2003, beating the hosts 20-17 in added extra time (AET).
2007 Rugby World Cup
Attendance figures for France 2007 were the highest they had ever been in Rugby World Cup history, hitting an average of 47,150 fans per match. Overall turnout was 2.2 million, by far the largest in Rugby World Cup history up until that point.
South Africa secured their second Rugby World Cup title in 2007, winning 15-6 against England in the final.
2011 Rugby World Cup
The 2011 Rugby World Cup was the first to be held exclusively in New Zealand. Due to infrastructure restrictions, and disruption due to an earthquake, attendance dropped to under 1.5 million. However, UK TV viewing figures topped 6.6 million, with global viewership figures estimated to be 750 million.
New Zealand beat France 8-7 in a hard-fought victory.
2015 Rugby World Cup
In 2015, the tournament was hosted once again by England and Wales, with Wembley Stadium, London’s Olympic Stadium, and Manchester City’s Etihad Stadium hosting the games. The 2015 competition holds the record for the highest total attendance at a Rugby World Cup (almost 2.5 million) and the highest average attendance at a Rugby World Cup (over 51,600 per game).

New Zealand were crowned champions once more in 2015, beating Australia 34-17.
2019 Rugby World Cup
In 2019, the Rugby World Cup broke new ground by heading east to Japan. While attendance was down on previous Rugby World Cups, around 1.68 million people still went to matches (at an average of 37,745 per game). Global viewership was also extraordinarily high. Cumulatively, 857 million people worldwide tuned in to watch the 2019 Rugby World Cup, a new record.
South Africa beat England 32-12 in the final, earning their third title and drawing level with New Zealand in terms of Rugby World Cup victories.
2023 Rugby World Cup
World Rugby has found a happy balance in terms of host selection, opting to prioritise spectator numbers in one World Cup before focusing on reaching and engaging new fans in the next.
The 2023 Rugby World Cup is exclusively in France, with stadiums in cities such as Bordeaux, Toulouse, and Nice hosting games. The competition begins on the 8 of September, and the final will be held on 28 October at the Stade de France in Saint-Denis, Paris.
Future Rugby World Cup tournaments
The 2027 Rugby World Cup is being hosted in Australia, followed by the United States in 2031.
Rugby World Cup match statistics
Number of tries at Rugby World Cups
The tournament that yielded the most tries per match is the 1987 Rugby World Cup, with a total of 224 tries across 32 matches and an average of seven tries per game. New Zealand alone were responsible for more than 5% of these, having crossed the try line an impressive 43 times during the tournament.
With just 148 tries over 32 matches, the 1991 Rugby World Cup saw the lowest return in tries per match (4.63).
A breakdown of Rugby World Cup statistics based on the number of tries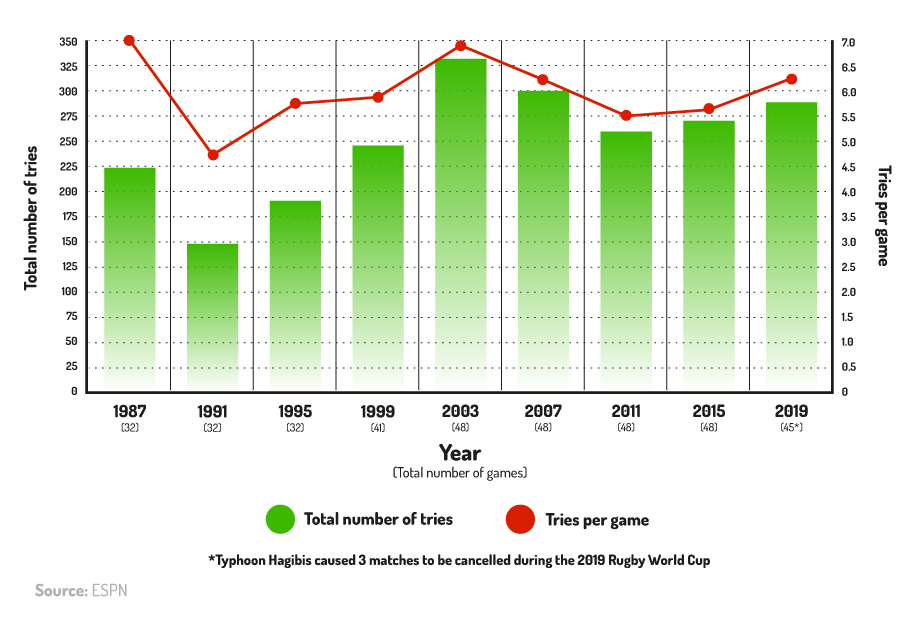
The most tries at a Rugby World Cup was in 2003, with a total of 332. However, by this point in time, the number of matches at a Rugby World Cup had risen to 48. This meant the average per match stood at 6.9 for the 2003 Rugby World Cup—the second-highest average of all time.
During the 2003 Rugby World Cup, the Pool Stages were extended, meaning that each team would play four matches instead of three. This gave the heavyweights more of a chance to boost their try tally against the sport’s lesser-developed nations. Australia, for example, beat Namibia 142-0, while England scored 16 tries alone against Uruguay during the 2003 Rugby World Cup in a 111-13 mauling.
However, as the minnows have gradually improved, the score lines between them and the bigger hitters have narrowed. You still get drubbings, but the margin of victory has shrunk. No nation has scored more than 100 points in a single Rugby World Cup match since 2007.
At the same time, New Zealand was the only nation to score more than 70 points in the 2019 Rugby World Cup when they beat Namibia 71-9.
How long is the ball in play during a Rugby World Cup?
At the 2019 Rugby World Cup, the ball was in play for an average of 34 minutes and 21 seconds per match (or 43% of a typical game). However, at the 1995 Rugby World Cup, the number of minutes of active play stood at just 25 minutes and 45 seconds (or 33% of the average match).
This means rugby fans in 2019 were seeing the ball in play a third (33%) more than those at the 1995 Rugby World Cup.
A breakdown of Rugby World Cup statistics to show the average number of active minutes per match at a Rugby World Cup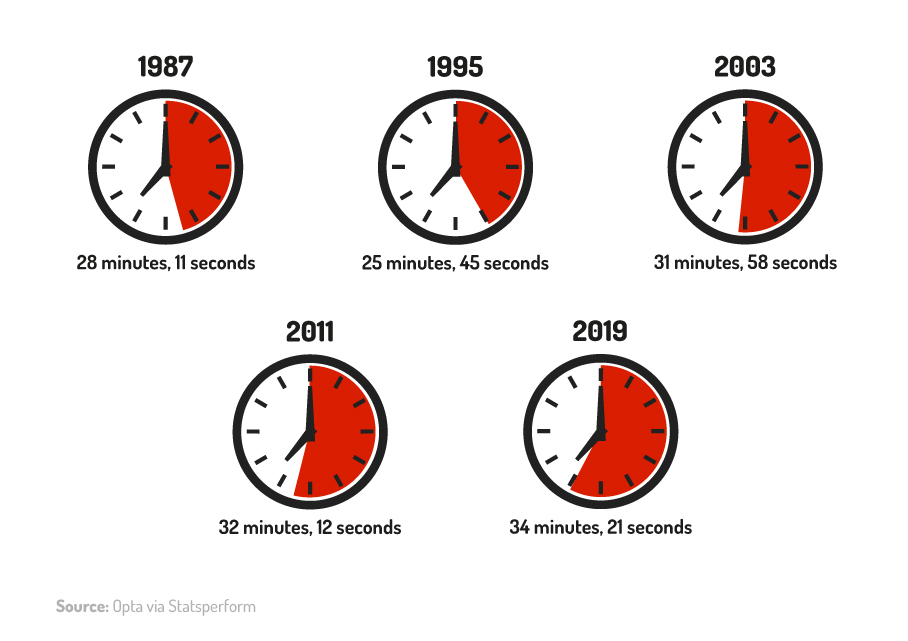
World Rugby has introduced a number of policies designed to speed up the game of international rugby, such as:
- Time limits for penalties and conversions.
- Reprimanding players for walking away with the ball after the whistle has been blown.
All of this has meant that since the 2003 Rugby World Cup, spectators have been able to enjoy at least 30 minutes of active rugby on average per game during the tournament.
Rugby World Cup scrum statistics
Since the 1987 Rugby World Cup, the average number of scrums per match has gradually decreased, from 32 down to a low of 13 per game in 2015.
Incidentally, the scrum win percentage for both of these tournaments was about the same (89% and 88%, respectively) and some of the lowest figures recorded across the previous nine Rugby World Cups.
A breakdown of Rugby World Cup scrum statistics (1987-2019)
|
Rugby World Cup (year)
|
Average number of scrums per game
|
Scrum win percentage (%)
|
Number of scrum penalties per game
|
|
1987
|
32
|
89%
|
2.9
|
|
1991
|
31
|
93%
|
3.5
|
|
1995
|
23
|
95%
|
2.3
|
|
1999
|
22
|
92%
|
4.3
|
|
2003
|
22
|
92%
|
3.5
|
|
2007
|
19
|
90%
|
2.6
|
|
2011
|
17
|
88%
|
4.8
|
|
2015
|
13
|
88%
|
4.4
|
|
2019
|
14
|
95%
|
3.7
|
(Source: Opta via Statsperform)
The highest scrum win percentage (95%) was seen at both the 1995 and 2019 Rugby World Cups.
The number of scrum penalties per game fluctuated between 1987 and 2019, reaching a low of 2.3 scrum penalties per match at the 1995 Rugby World Cup and a high of 4.8 at the 2011 tournament.
Rugby World Cup lineout statistics
Since the 1987 Rugby World Cup, the average number of lineouts per match has gradually decreased, from 45 per game in 1987 to a low of 24 per match in 2011.
Prior to the 1995 Rugby World Cup, the lineout win percentage remained below 75%. The lowest-recorded figures were from the 1987 tournament when just over two-thirds (68%) of lineouts were successful.
A breakdown of Rugby World Cup lineout statistics (1987-2019)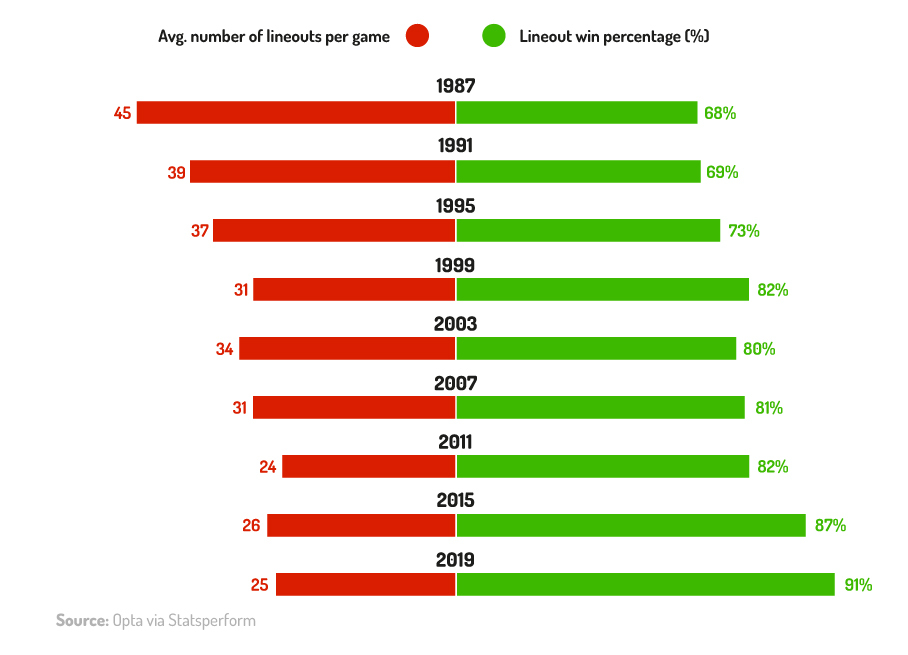
In 1999, lifting was allowed as a viable tactic in the game of rugby, meaning more and more lineouts ended up with the team in possession. The lineout win percentage from 1999 shot up to 82% and has recently increased to 87% (2015) and 91% (2019).
Rugby World Cup stats on carries, rucks, and tackles
In the 1991 Rugby World Cup, teams made 129 combined carries and tackles per game on average. This was the lowest total of all Rugby World Cups on record and a stark contrast to the 244 combined total for the 2019 Rugby World Cup in Japan.
In 1991, the average team registered just 77 carries and 52 tackles per match, compared to typically 115 and 129, respectively, for nations that competed in the 2019 tournament.
A breakdown of Rugby World Cup statistics by the number of carries, rucks, and tackles
|
Rugby World Cup (year)
|
Average number of carries per team
|
Average number of tackles per team
|
Percentage of successful tackles (%)
|
Average number of rucks per team
|
|
1987
|
86
|
48
|
70%
|
25
|
|
1991
|
77
|
52
|
75%
|
29
|
|
1995
|
78
|
58
|
76%
|
38
|
|
1999
|
93
|
82
|
81%
|
57
|
|
2003
|
107
|
96
|
81%
|
68
|
|
2007
|
80
|
84
|
87%
|
65
|
|
2011
|
99
|
98
|
88%
|
77
|
|
2015
|
113
|
119
|
85%
|
83
|
|
2019
|
115
|
129
|
84%
|
82
|
(Source: Opta via Statsperform)
As the game of rugby has become more professional over the years, we’re seeing fewer and fewer missed tackles. Back in 1987, seven in 10 (70%) tackles made by teams across the tournament were successful. By 2011, this figure had risen to 88%–the highest in recent years.
In addition, the average number of rucks per team has also grown with each passing tournament. Between 1987 and 2019, the typical number of rucks per team more than tripled, from 25 to 82.
During the semi-final of the 2019 Rugby World Cup, England’s Mario Itoje recorded 66 rucks against New Zealand–the most recorded by a single player at the tournament in Rugby World Cup history. This was 12 more rucks than the combined averages for teams at the 1987 and 1991 tournaments and greater than the average number of rucks per team in both 1995 and 1999.
Rugby World Cup stats on offloads and turnovers
Between 1987 and 2019, the percentage of offloads across the Rugby World Cup tournaments has halved from 30% to 15.1%, respectively. A similar trend can be seen in the percentage of turnovers conceded, going from almost 60% in 1987 to 30.8% in 2019.
A breakdown of Rugby World Cup statistics by number of offloads and turnovers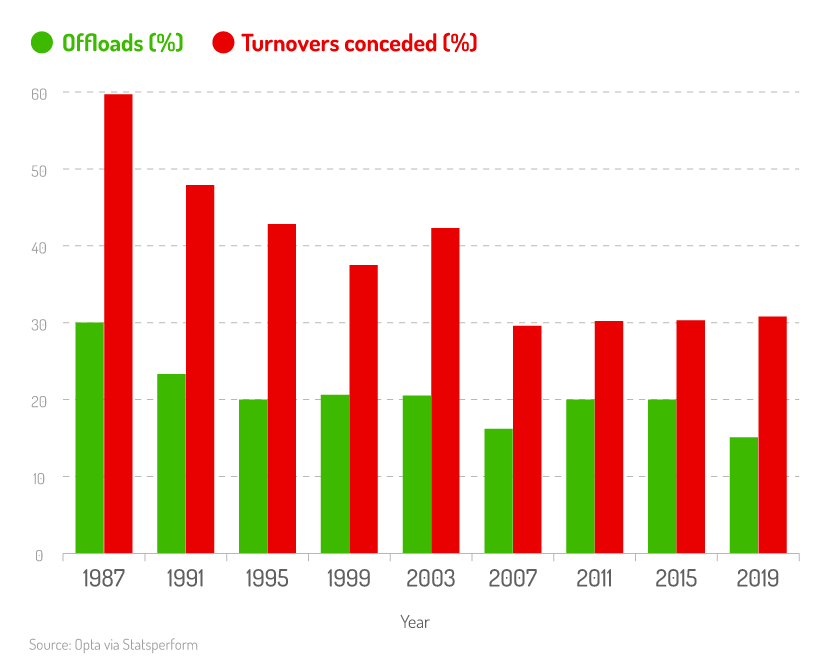
While the percentage of offloads has gradually decreased since 1987, the percentage of turnovers conceded has fluctuated between tournaments. In 2003, this figure rose to 42.3% but then dropped in the 2007 tournament to an all-time low of 29.6%.
Rugby attendance statistics across Rugby World Cups
Since 1987, there has been general growth in total and average attendance figures, with some fluctuations between tournaments.
The first Rugby World Cup in 1987 had the lowest total attendance of any tournament to date, with less than 500,000 fans going to watch games across the competition. This yielded an average attendance of less than 15,000–the lowest in Rugby World Cup history.
A breakdown of rugby attendance statistics between 1987-2019
Rugby World Cup attendance statistics more than doubled for the 1991 tournament, to just over a million fans attending matches, at an average of nearly 32,000 per game.
Total attendance figures surpassed two million for the first time at the 2007 Rugby World Cup, with an average attendance of 47,150 per match.
The record for the highest total attendance at a Rugby World Cup is currently held by England. In 2015, almost 2.5 million fans took to the stands to watch the tournament unfold, with an average attendance of 51,621 per game.
2019 Rugby World Cup revisited
The 2019 Rugby World Cup in Japan was the ninth competition of its kind and the first to take place in Asia.
Despite the initial controversy about Japan – a nation which had never gone beyond the first round–winning the rights to host the competition proved to be a success. This generated the most revenue (£4.3 billion) of any Rugby World Cup to date.

On the pitch, South Africa became champions for the third time, defeating England 32-12 in the final. As for the hosts, Japan delivered their best-ever Rugby World Cup performance, reaching the quarter-finals for the first time before bowing out 23-6 to eventual champions, South Africa.
Which team scored the most points at the 2019 Rugby World Cup?
South Africa ended up the victors in the 2019 World Cup, but they also topped the table for highest point scorers, securing 262 points over their seven matches.
Despite their campaign beginning with a defeat to New Zealand, the Springboks were still able to stack up plenty of points in the pool stage. They defeated fellow African side Namibia 57-3 before beating Canada 66-7.

Across their Rugby World Cup campaign, the Springboks had just one game where they scored fewer than 15 points (a 23-13 defeat against New Zealand). To put their scoring into perspective, South Africa earned 37% more points throughout the competition than fellow finalists England, who ended their campaign with 190 points over six matches (the third highest overall).
A breakdown of the 10 highest-scoring teams at the 2019 Rugby World Cup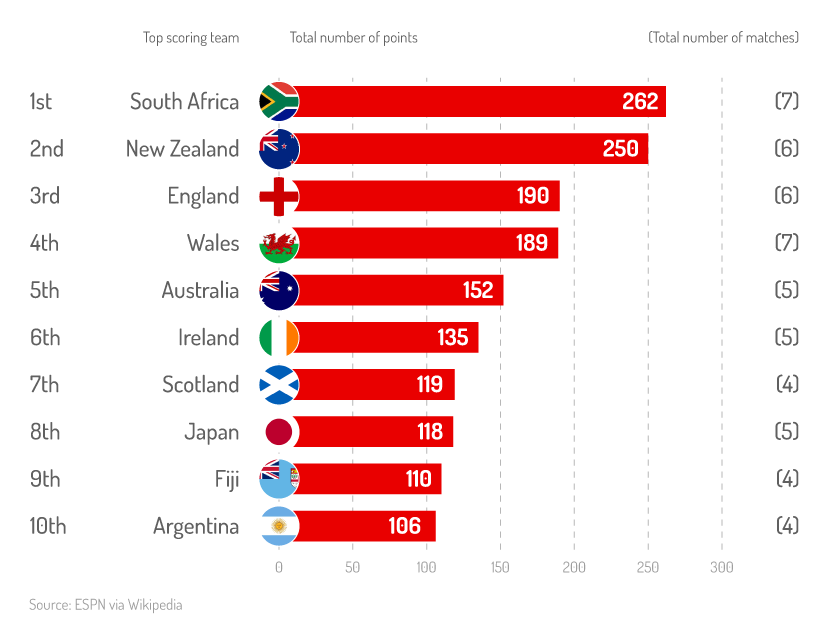
New Zealand scored the second-highest points at the 2019 Rugby World Cup, with a total of 250 over six matches. While this was 12 less than South Africa, Rugby World Cup statistics show the All Blacks had the best points per game ratio of any side (41.7). New Zealand’s 71-9 victory over Namibia in the pool stage was the highest number of points scored in a single game in the competition.
Finalists England were in third with 190 points, with semi-finalists Wales scoring the fourth-highest total (189), and quarter-finalists Australia finishing fifth (152).
The tournament's lowest scorers were Canada, who scored just 14 points over their four matches–an average of just 3.5 points per game. Canada was followed by Russia, who earned the second-lowest number of points across the tournament, scoring just 19 in four games.
Which player scored the most points at the 2019 Rugby World Cup?
The top scorer at the 2019 Rugby World Cup was South Africa’s Handre Pollard. Playing in only his second Rugby World Cup, the fly-half scored 69 points throughout the tournament–12 more than any other player in the competition. Pollard scored 16 penalties, nine conversions, and one drop goal, with 22 of his points scored in the final against England.
A breakdown of the five highest points scorers at the 2019 Rugby World Cup
|
Place
|
Points
|
Player
|
Nationality
|
|
1st
|
69
|
Handre Pollard
|
South Africa
|
|
2nd
|
58
|
Owen Farrell
|
England
|
|
3rd
|
54
|
Richie Mo’unga
|
New Zealand
|
|
4th
|
51
|
Yu Tamara
|
Japan
|
|
5th
|
41
|
Dan Biggar
|
Wales
|
(Source: ESPN)
In second place was England’s captain for the tournament, Owen Farrell (58 points). Farrell scored 12 penalties, 11 conversions, and no drop goals. In the final, Farrell was England’s only point scorer, with four penalties in total.
New Zealand’s full-back Richie Mo’unga was in third place and scored 54 points. The majority (20) of Mo'unga’s points were scored by conversions, making him the highest overall scorer for conversions in the tournament.
Rounding off the top five is Japan’s Yu Tamura with 51 points and Dan Biggar of Wales with 41 points. Tamura’s total was the second-highest number of points scored by a Japanese player in any Rugby World Cup to date.
Which team scored the most tries in the 2019 Rugby World Cup?
With 36 tries over six matches, semi-finalists New Zealand scored the most tries of any team at the 2019 Rugby World Cup. Averaging six per game, the All Blacks scored three more tries than eventual champions South Africa (33), despite competing in one less match.
Nearly a third (31%) of New Zealand's tries were scored in the 71-9 pool stage victory over Canada, with their 11 tries in that match the highest number scored in a single match at the competition. Overall, the All Blacks scored 19 tries in their three group matches and then scored 14 tries throughout the knockout stages.
A breakdown of the 10 teams who scored the most tries at the 2019 Rugby World Cup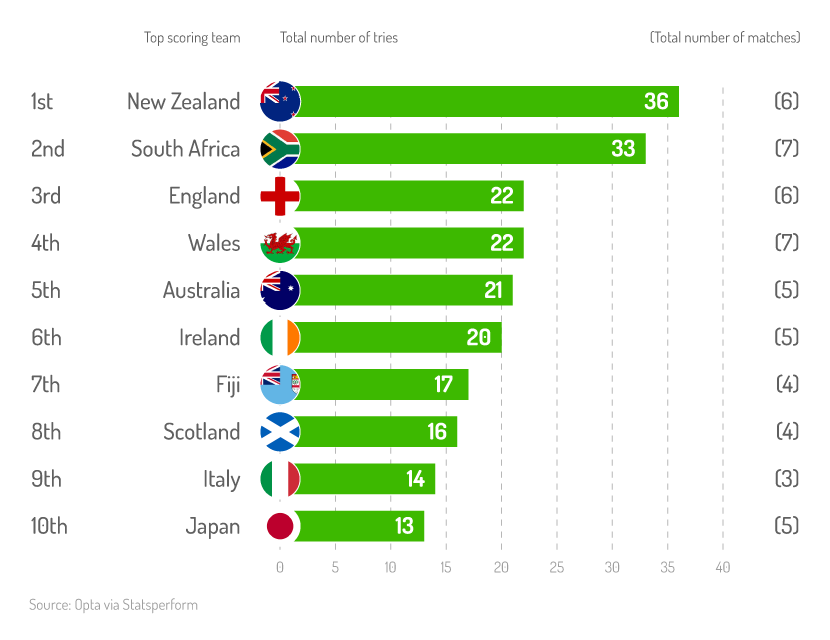
Following New Zealand was South Africa, with the Springboks’ total of 33 tries—a remarkable 50% more than the next highest nations (England and Wales). Although England (third) and Wales (fourth) both scored 22 tries in the tournament, England rank higher in the table having played one less game than their British counterparts (six versus seven, respectively).
Though Australia's total try count of 21 was only the fifth highest on the list, their tries per game ratio of 4.2 was higher than both Wales and England and was the third-highest overall.
The teams that scored the lowest number of tries in the competition were as follows:
- Russia: 1 try
- Canada: 2 tries
- Namibia: 3 tries
Collectively, these three nations scored just six tries over a combined 12 matches.
Which player scored the most tries in the 2019 Rugby World Cup?
The top try-scorer in the 2019 Rugby World Cup was Wales’ Josh Adams. The winger opened his account in the 19th minute of Wales’ first match against Georgia before adding a hat-trick of tries in the third game against Fiji.
Adams added another in the final group match against Uruguay before scoring his final one in the semi-final defeat to South Africa. Overall, Adams’ tally of seven tries in six matches means he was the only player in the tournament to average more than one try per game.
A breakdown of the players who scored the most tries at the 2019 Rugby World Cup
|
Place
|
Tries
|
Player
|
Nationality
|
|
1st
|
7
|
Josh Adams
|
Wales
|
|
2nd
|
6
|
Makazole Mapimpi
|
South Africa
|
|
3rd
|
5
|
Kotaro Matsushima
|
Japan
|
|
4th
|
4
|
Julian Motoya
|
Argentina
|
|
5th
|
4
|
Kenki Fukuoka
|
Japan
|
|
6th
|
4
|
Ben Smith
|
New Zealand
|
(Source: ESPN)
The top three was rounded off by Makazole Mapimpi of South Africa who scored six tries, and Japan's Kotaro Matsushima who managed five. Japan was the only nation to have two players in the top five, with the hosts’ winger Kenki Fukuoka finishing joint-fourth on four tries.
Which players scored the most drop goals at the 2019 Rugby World Cup?
Drop goals appear to be a dying art in the world of Rugby Union. Back in 2003, England alone scored eight drop goals, whereas in 2019, there were only six scored in the entire tournament.
Wales were the top scorers, striking two successful drop goals. No individual player scored more than one drop goal throughout the competition. Other teams that earned points through a drop goal were South Africa, France, Scotland, and Russia.
A breakdown of every player that scored a drop goal at the 2019 World Cup
|
Player
|
Country
|
|
Camille Lopez
|
France
|
|
Yuri Kushnarev
|
Russia
|
|
Stuart Hogg
|
Scotland
|
|
Handre Pollard
|
South Africa
|
|
Dan Biggar
|
Wales
|
|
Rhys Patchell
|
Wales
|
(Source: ESPN)
Which team received the most yellow and red cards at the 2019 Rugby World Cup?
There were eight red cards dished out in the 2019 World Cup, with no team receiving more than one. The teams that received red cards were France, Ireland, Argentina, Italy, Samoa, Uruguay, Canada, and the USA.
A breakdown of every player that received a red card at the 2019 Rugby World Cup
|
Player
|
Team
|
Opponents
|
|
John Quill
|
USA
|
England
|
|
Facundo Gattas
|
Uruguay
|
Georgia
|
|
Ed Fidow
|
Samoa
|
Scotland
|
|
Andrea Lovotti
|
Italy
|
South Africa
|
|
Tom Lavanini
|
Argentina
|
England
|
|
Josh Larsen
|
Canada
|
South Africa
|
|
Bundee Aki
|
Ireland
|
Samoa
|
|
Sebastian Vahaamahina
|
France
|
Wales
|
(Source: ESPN)
The first player to get sent off in the 2019 Rugby World Cup was American flanker John Quill in his side’s 45-7 defeat to England. The last player to get sent off, and the only player to be shown a red card in a knockout stage match, was France’s Sebastien Vahaamahina in a 29-19 defeat to Wales in the quarter-finals.
Of the players to receive a red card, just one ended up on the winning side. Bundee Aki of Ireland was given his marching orders in the 29th minute of a 47-5 victory over Samoa.
A breakdown of the teams that received the most yellow cards at the 2019 Rugby World Cup
|
Place
|
Yellow Cards
|
Team
|
|
1st
|
6
|
Samoa
|
|
2nd
|
3
|
New Zealand
|
|
2nd
|
3
|
Australia
|
|
2nd
|
3
|
Fiji
|
|
2nd
|
3
|
Russia
|
|
2nd
|
3
|
Wales
|
(Source: ESPN)
Despite bowing out of the pool stage, Samoa were the worst culprits for receiving yellow cards at the 2019 Rugby World Cup. The Samoans were handed six yellow cards in just four matches–twice as many as any other team–and an average of 1.5 bookings per game.
They received at least one yellow card in every single match they played, and they had two players sin-binned in fixtures against Russia and Ireland. Two of their players, Ed Fidow and TJ Ioane, received two yellow cards, making them the only players in the competition to be carded twice.
There were a further five sides who received three yellow cards in total–Wales, Russia, New Zealand, Australia, and Fiji.
At the other end of the scale, four teams didn’t receive a single yellow or red card. Scotland, England, Japan, and Tonga all managed to go the entire tournament without getting in the referee's bad books. England’s disciplinary record is most impressive, given that they made it all the way to the final without receiving a single card.
Which teams had the best and worst defences at the 2019 Rugby World Cup?
In 2019, Scotland conceded the least points in the tournament, shipping just 55 points over four games. This figure was 12 points lower than any other side and meant they had an average points concession rate of 13.75 per game.
However, it’s worth noting that Scotland was eliminated from the Rugby World Cup after four matches, meaning there were other teams that advanced further and conceded fewer points per game.
A breakdown of the 10 teams that conceded the least points at the 2019 Rugby World Cup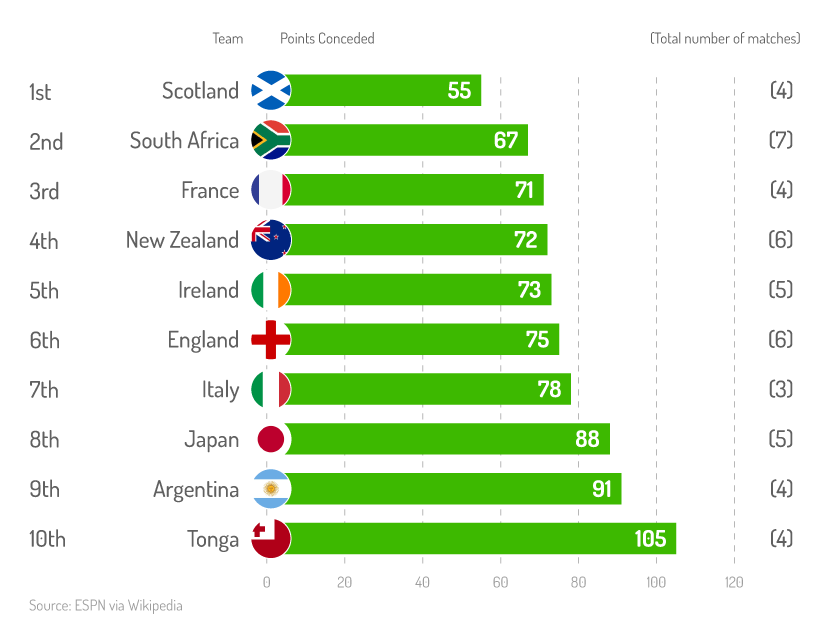
The team with the least points conceded per match at the 2019 Rugby World Cup was South Africa. Across their seven matches, South Africa conceded just 67 points (the second-lowest overall), which averaged just 9.5 points per match.
Other teams with dominant defences included:
- France (third) who conceded just 71 points
- New Zealand (fourth) who conceded 72 points
- Ireland (fifth) who conceded 73 points
A breakdown of the five teams that conceded the most points at the 2019 Rugby World Cup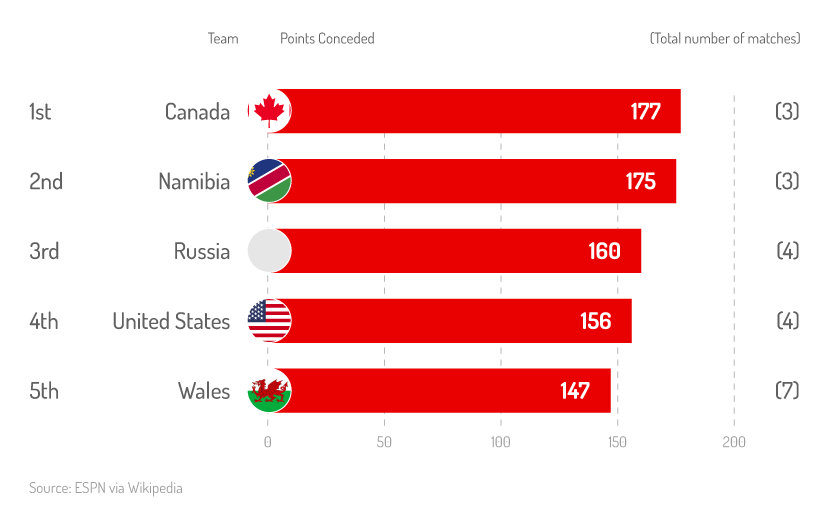
Canada had the worst defensive record at the 2019 Rugby World Cup. In their three matches, they conceded 177 points, averaging 59 points per game. In their 63-0 defeat to South Africa, Canada conceded four fewer points than the eventual World Champions would concede in the entire tournament.
Namibia conceded marginally fewer points than Canada, with 175 over three games. Both Canada and Namibia conceded at least 9% more points than the rest of the top five, despite having played fewer games than the other three nations.
The remainder of the list is rounded off by Russia (third), the USA (fourth), and Wales (fifth), who conceded 160, 156, and 147 points, respectively.
Which player made the most tackles at the 2019 Rugby World Cup?
The player with the most tackles at the 2019 Rugby World Cup was Wales’ legend Alun Wyn Jones. The Welsh lock may have been 34 at the time but, despite his age, he was still able to bring down a staggering 79 players–10 more than any other player in the tournament.
A breakdown of the 5 players that made the most tackles at the 2019 Rugby World Cup
|
Place
|
Tackles made
|
Player
|
Team
|
|
1st
|
79
|
Alun Wyn Jones
|
Wales
|
|
2nd
|
69
|
Kieran Reed
|
New Zealand
|
|
3rd
|
68
|
Pieter Labuschagne
|
Japan
|
|
4th
|
67
|
James Moore
|
Japan
|
|
5th
|
67
|
TJ Ioane
|
Samoa
|
(Source: ESPN)
Aside from Wyn-Jones, there were plenty of other players who weren’t afraid to put their necks on the line at the 2019 Rugby World Cup.
Kieran Read of New Zealand clocked up 69 tackles, while Japan’s Pieter Labuschagne (third) made 68 tackles. Japan was the only nation to have two players in the top five, with James Moore finishing joint-fourth alongside Samoa’s T J Loane on 67 tackles.

Which player made the most clean breaks at the 2019 Rugby World Cup?
When it came to clean breaks at the 2019 Rugby World Cup, one player stood head and shoulders above all others. Welsh winger Josh Adams managed to breach defensive lines a total of 18 times. This was 50% higher than any other player at the tournament.
A breakdown of the players that made the most clean breaks at the 2019 Rugby World Cup
|
Place
|
Clean break
|
Player
|
Team
|
|
1st
|
18
|
Josh Adams
|
Wales
|
|
=2nd
|
12
|
Beauden Barrett
|
New Zealand
|
|
=2nd
|
12
|
Jordie Barrett
|
New Zealand
|
|
=2nd
|
12
|
Marika Koroibete
|
Australia
|
|
=2nd
|
12
|
Sevu Reece
|
New Zealand
|
(Source: ESPN)
Behind Adams, there were four players that managed 12 clean breaks, all coming in joint second place. These players were World Rugby Player of the Year 2016 and 2017 Beauden Barrett, Jordie Barrett, Marika Koroibete, and Sevu Reece.

All-time teams in Rugby World Cups
How many Rugby World Cup winning teams are there?
Since New Zealand won the inaugural Rugby World Cup back in 1987, there have been four different winners, with Australia, South Africa, and England all lifting the trophy.
With three tournament victories each, New Zealand and South Africa share the top spot in the Rugby World Cup winners list as the world’s two most successful rugby nations.
A breakdown of Rugby World Cup winners, from 1987 to 2019
|
Rugby World Cup winners
|
Years won
|
|
New Zealand
|
1987, 2011, 2015
|
|
South Africa
|
1995, 2007, 2019
|
|
Australia
|
1991, 1999
|
|
England
|
2003
|
(Source: Rugby World Cup Records)
 New Zealand
According to Rugby World Cup statistics, New Zealand were the first winners of the tournament in 1987, succeeding on home soil. The All Blacks won six out of six matches, ending with a 29-9 triumph over France.
After a 24-year wait, New Zealand won the 2011 Rugby World Cup, and repeated the feat in 2015.
 South Africa
Like New Zealand, South Africa has also won three Rugby World Cups–a remarkable achievement, having been excluded from competing until the third edition. The Springboks won the first Rugby World Cup they contested, raising the trophy in 1995 after beating rivals New Zealand in the final.
The Springboks secured their second title in 2007, beating England by a score of 37-20. South Africa, once again, beat the likes of France and New Zealand 12 years later to gain their third Rugby World Cup title.
 Australia
Australia’s first Rugby World Cup triumph came in 1991. They saw off favourites New Zealand in the semi-final after a dramatic clash in Dublin. They then travelled to Twickenham to take on hosts England, with the final result standing at 12-6 to the Wallabies.

Just eight years later, in 1999, Australia broke World Cup Rugby records, becoming the first team to win two World Cups. They achieved this by defeating France 35-12 in the final.
 England
Rugby World Cup stats reveal that England’s solitary World Cup victory came in 2003. Under manager Clive Woodward, England topped their group defeating both Wales and France along the way. In the final, England were crowned winners after extra-time with a 20-17 scoreline.
Despite being finalists in both the 2007 and 2019 competitions, England hasn’t lifted the Rugby World Cup since 2003.
A breakdown of cumulative points scored by Rugby World Cup national teams from 1987 to 2019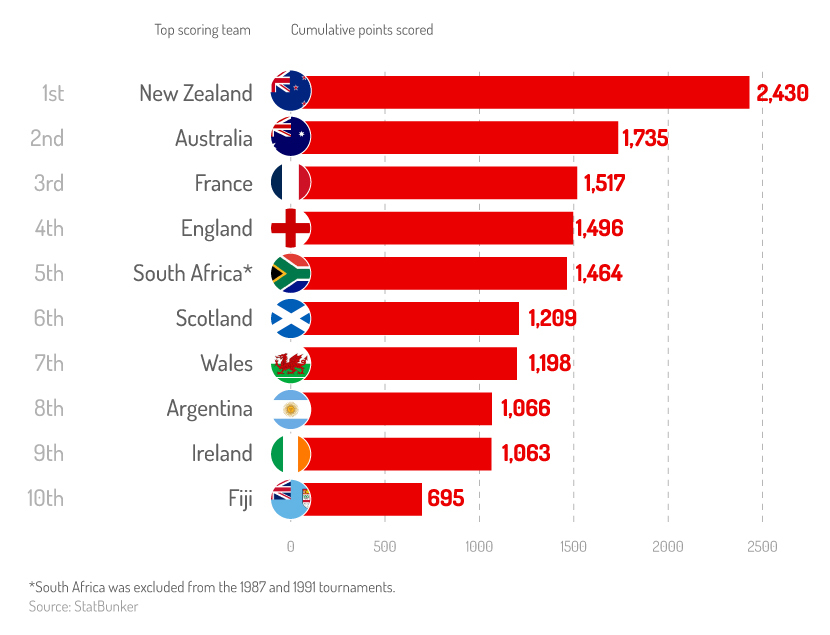
Rugby World Cup history statistics identify New Zealand as the highest-scoring national team, with a cumulative points total of 2,430 over nine campaigns. The highest-scoring match for the All Blacks was in 1995. Facing competition from a lacklustre Japan, the New Zealand team decimated them 145-17.
Neighbouring Australia has scored 695 fewer points than New Zealand over all Rugby World Cup competitions, at 1,735. Their best campaign was in 2003 when the Wallabies scored 302 points throughout the competition. Unfortunately, having reached the final, they were beaten by England 20-17.
Despite never winning the competition, France is the third-highest-scoring team in Rugby World Cup history. Les Bleus have a strong World Cup record and have reached the final on three occasions (1987, 1999, and 2011).
In fourth place is England. Across nine campaigns, they’ve scored 1,496 points–just over a thousand fewer than New Zealand in first place.
In last place is Fiji. Rugby World Cup history statistics reveal that the Pacific island nation has scored just 695 points across nine campaigns. This puts them a remarkable 1,735 points behind leaders New Zealand.
A breakdown of the highest try-scoring teams in Rugby World Cup History, from 1987 to 2019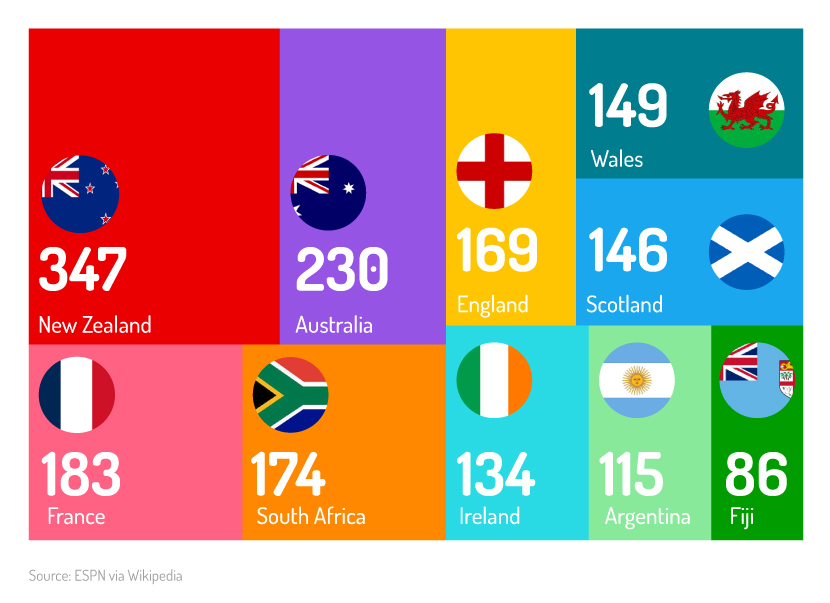
Of all the Rugby World Cup teams, New Zealand’s All Blacks have got the ball over their opponents’ try-line the most times. With 347 tries registered over Rugby World Cup history, this averages out to 38.5 tries per tournament or 6.2 tries per game. In 2019 alone, the All Blacks scored nine tries against Canada before scoring another 11 tries against Namibia shortly after.
In second place, Australia has managed 230 tries in nine tournaments. One of their best campaigns for tries scored was in 2003, with the Wallabies scoring 43 tries on their way to the final. Along the way, they set a Rugby World Cup record for the largest win margin, beating Namibia 142-0 in a group-stage match.
Rugby World Cup statistics show that France has scored just 183 tries in their nine contested World Cups. At the inaugural 1987 Rugby World Cup, they scored 34 tries in just six matches. However, the European team suffered a dip in form in 2019, managing to score only 12 tries across the whole competition.
South Africa is in fourth with 174 tries. Despite having competed in two fewer World Cups than their counterparts, the African nation is only behind France by nine tries.
Rounding off the top five is England on 169 tries. While the nation may have won one Rugby World Cup and competed in two finals, they have achieved less than half of the tries scored by leaders New Zealand.
What Rugby World Cup team commits the most red card fouls?
In Rugby World Cup history, just 25 players have been given red cards by the referee, and no player has ever received two red cards in their World Cup career.
The nation with the highest quantity of red-carded players is Canada, with four incidents warranting a sending off and removal from the pitch. The first Canadian player to be shown a red card was then-captain Gareth Rees, who was part of a brawl against opposition side South Africa in 1995. In the same match, Canada’s Rod Snow was also shown a red card.
Their most recent red card offence was at the 2019 Rugby World Cup when Josh Larsen committed an illegal, no-arms charge ruck against South Africa.
A breakdown of the nation with the most red cards in Rugby World Cup history
|
Ranking
|
Number of red cards
|
Country
|
|
1st
|
4
|
Canada
|
|
2nd
|
3
|
Samoa, Tonga
|
|
3rd
|
2
|
Argentina, South Africa, Uruguay, Wales
|
|
4th
|
1
|
Australia, France, Ireland, Italy, Namibia, USA
|
|
5th
|
0
|
England, New Zealand, Scotland
|
(Source: ESPN via Wikipedia)
Other red card culprits include Samoa and Tonga, who have both had three red cards.
Argentina, South Africa, and Uruguay have all had two red cards across their appearances at a Rugby World Cup.
At the other end of the spectrum, some teams have a perfect disciplinary record when it comes to red cards. Despite competing in every World Cup, no player from New Zealand, England, or Scotland has ever been sent off.
A breakdown of the highest margin wins in Rugby World Cup history, from 1987 to 2019
|
Margin
|
Team
|
Opponent
|
Score
|
Year
|
|
142 points
|
Australia
|
Namibia
|
142-0
|
2003
|
|
128 points
|
New Zealand
|
Japan
|
145-17
|
1995
|
|
98 points
|
New Zealand
|
Italy
|
101-3
|
1999
|
|
98 points
|
England
|
Uruguay
|
111-13
|
2003
|
|
95 points
|
New Zealand
|
Portugal
|
108-13
|
2007
|
(Source: ESPN)
According to Rugby World Cup stats, Australia’s infamous victory over Namibia holds the record for the largest win margin in Rugby World Cup history. Namibia didn’t register a single point during the match, whereas the rampant Wallabies secured 142. Chris Latham scored a record five tries in one game, with Matt Rogers scoring two tries and 16 successful conversions.
New Zealand’s dominant 1995 display over Japan yielded the highest-scoring game in Rugby World Cup history. The All Blacks scored 145, with Japan registering just 17. New Zealand’s national team features three times in the top five highest-scoring margin games, demonstrating the side’s effective displays of attack and defence.
A breakdown of nations with the highest average fan attendance at Rugby World Cup matches, from 1987 to 2019
|
Team
|
Total attendance (across all Rugby World Cups)
|
Average attendance
|
|
New Zealand
|
2,775,193
|
49,557
|
|
England
|
2,475,118
|
49,502
|
|
Australia
|
2,390,777
|
45,109
|
|
France
|
2,189,364
|
42,103
|
|
South Africa
|
2,050,079
|
47,676
|
|
Wales
|
1,945,432
|
44,214
|
|
Scotland
|
1,638,398
|
39,009
|
|
Ireland
|
1,590,857
|
39,771
|
|
Argentina
|
1,561,180
|
38,078
|
|
Fiji
|
1,051,005
|
32,844
|
(Source: LiveRugbyTickets.co.uk via ESPN and Wikipedia)
According to Rugby World Cup statistics, New Zealand’s All Blacks have the highest cumulative attendance of fans. Across all Rugby World Cup matches between 1987 and 2019, a remarkable 2.77 million people saw the All Blacks play, meaning an average match attendance of 49,557 rugby fans.
England, the birthplace of rugby, has a similarly strong fanbase to that of New Zealand’s national team. Over their nine Rugby World Cups contested, almost 2.5 million people cumulatively watched the Lions play, with an average match attendance of 49,502. This is just 55 fewer fans per rugby game than that of the New Zealand All Blacks.

South Africa has contested fewer Rugby World Cups than their counterparts due to political unrest surrounding apartheid in the ‘80s and early ‘90s. Once the apartheid government fell, the Springboks hosted, competed, and won the 1995 Rugby World Cup. From 1995 to 2019, over two million people cumulatively attended World Cup games featuring South Africa, leading to a remarkable average attendance of over 47,600 people per match.
Rugby World Cup statistics reveal that the island nation of Fiji yields matches with the smallest average attendance. Around 32,800 fans go to games contested by the Fiji Bati squad. However, this translates to over one million attendees across all Rugby World Cup competitions.
Which team has lost the highest percentage of matches after leading at half-time in the Rugby World Cup?
The United States has lost the highest percentage of games after leading at half-time in the Rugby World Cup. The Eagles have lost four of the seven games in which they led at half-time, making them the only nation to have tasted defeat in more than half (57%) of the games they were winning at the halfway point.
A breakdown of the 10 teams with the highest percentage of defeats after leading at half-time in the Rugby World Cup
|
Team
|
Ahead at half-time then losing the game
|
Total ahead at half-time count
|
Percentage half-time winning to losing
|
|
United States
|
4
|
7
|
57.14
|
|
Samoa
|
5
|
15
|
33.33
|
|
Canada
|
3
|
9
|
33.33
|
|
Scotland
|
6
|
26
|
23.08
|
|
Georgia
|
1
|
5
|
20.00
|
|
Fiji
|
2
|
12
|
16.67
|
|
Argentina
|
3
|
20
|
15.00
|
|
Ireland
|
4
|
27
|
14.81
|
|
Wales
|
2
|
21
|
9.52
|
|
Australia
|
3
|
40
|
7.50
|
(Source: LiveRugbyTickets.co.uk via ESPN and Wikipedia)
The USA is followed by Samoa and Canada, who’ve both lost a third (33%) of the games they were winning at half-time. Samoa has lost a game more than the USA when leading at half-time (five) but has had more than double the number of half-time leads in total (15 versus seven, respectively).
With six defeats from winning positions at the half-time whistle, fourth-placed Scotland has relinquished more half-time leads than any team in Rugby World Cup history. The most notorious instance of Scotland’s six defeats came in the 2015 quarter-finals when their first half-lead was agonisingly pegged back in a 35-34 defeat to Australia.

Completing the top five is Georgia, who obtained a losing percentage of 20% from winning half-time positions, thanks to a solitary defeat among their five half-time leads.
Australia is the only previous winner to feature in the top 10, with their three defeats from 40 half-time leads placing them tenth and a losing percentage of 7.5%.
What Rugby World Cup teams have come back from losing positions?
England has the highest win rate from losing positions of all Rugby World Cup teams. Of the 18 matches in which England were behind at the half-time break, on seven occasions the Lions came back to win. That means an almost 40% rate for converting losses to wins during Rugby World Cup matches.
A breakdown of Rugby World Cup teams who were behind at half-time and recovered to win (1987-2019)
|
Nation
|
Half-time loss to win converted
|
Half-time losses overall
|
Percentage half-time winning to losing
|
|
England
|
7
|
18
|
38.9
|
|
New Zealand
|
3
|
8
|
37.5
|
|
South Africa
|
2
|
6
|
33.3
|
|
Wales
|
7
|
22
|
31.8
|
|
Scotland
|
4
|
14
|
28.6
|
|
France
|
4
|
17
|
23.5
|
|
Australia
|
2
|
9
|
22.2
|
|
Argentina
|
4
|
20
|
20.0
|
|
Romania
|
4
|
24
|
16.7
|
|
Samoa
|
2
|
16
|
12.5
|
(Source: LiveRugbyTickets.co.uk via ESPN and Wikipedia)
Further showing their winning mentality, New Zealand feature in second place on the list. Of the eight matches in which they were behind at half-time, the All Blacks fought back on three occasions to clinch victory, giving them a 37.5% comeback rate from half-time losing positions.
Akin to New Zealand, South Africa has three Rugby World Cup titles to their name. That hunger to win is what motivates the Springboks to come back from losing positions at half-time. Of the six matches in which they were behind at the break, they returned twice to beat their opponents, giving them a loss-to-win ratio of 33.3%.

The small island nation of Samoa yields the lowest win rate when behind at half-time, at 12.5% of their games. This means they only managed a victory in two of the 16 games where they were down at the break.
All-time players statistics in the Rugby World Cup
Which player has played the most games at the Rugby World Cup?
There are two players who have played more than any other at the Rugby World Cup, with Jason Leonard and Richie McCaw appearing for their respective countries 22 times on rugby’s grandest stage.
One of the toughest props to ever grace the field, Leonard made his World Cup debut in 1991 and made his final appearance as a substitute in England’s triumphant final victory over Australia in 2003.
A breakdown of the players with the most appearances in Rugby World Cup history
|
Place
|
Matches
|
Player
|
Nationality
|
Years
|
|
=1st
|
22
|
Jason Leonard
|
England
|
1991-2003
|
|
=1st
|
22
|
Richie McCaw
|
New Zealand
|
2003-2015
|
|
3rd
|
21
|
Alun Wyn Jones
|
Wales
|
2007-present
|
|
=4th
|
20
|
Schalk Burger
|
South Africa
|
2003-2015
|
|
=4th
|
20
|
George Gregan
|
Australia
|
1995-2007
|
|
=4th
|
20
|
Keven Mealumu
|
New Zealand
|
2003-2015
|
|
=7th
|
19
|
Sam Whitelock
|
New Zealand
|
2011-
|
|
=7th
|
19
|
Sonny Bill Williams
|
New Zealand
|
2011-2019
|
|
=7th
|
19
|
Adam Ashley-Cooper
|
Australia
|
2007-2019
|
|
=7th
|
19
|
Mike Catt
|
England
|
1995-2007
|
|
=7th
|
19
|
Jonny Wilkinson
|
England
|
1999-2011
|
(Source: Rugby World Cup Limited)
Cut from similar cloth, rugged flanker McCaw matched Leonard’s record in his final World Cup match. Making his Rugby World Cup debut against Italy in 2003, McCaw’s World Cup journey would also end in triumph, playing his final match as captain in New Zealand’s 2015 final win over Australia.

In third place is Wales stalwart Alun Wyn Jones, who currently sits on 21 appearances. Wyn Jones made his World Cup debut in 2007 and made his most recent appearance in the semi-final defeat to South Africa in 2019.
New Zealand was the nation with the most players in the top 10 (four), followed by England (three) and Australia (two), respectively.
Which player has captained their country most at the Rugby World Cup?
In Rugby Union, the captain is the heartbeat of the team. There are few, if any, greater honours than being the player to lead your nation out to the pitch at Rugby’s most prestigious competition. The player who has enjoyed this distinction more than any other is New Zealand’s Richie McCaw.
McCaw was awarded the captaincy in 2006, with the flanker going on to lead his country 13 times over three separate Rugby World Cups, including consecutive final victories against France (2011) and Australia (2015).
A breakdown of the 10 players that have captained their team most times at the Rugby World Cup
|
Place
|
Matches
|
Captain
|
Nationality
|
Years
|
|
1st
|
13
|
Richie McCaw
|
New Zealand
|
2007-2015
|
|
=2nd
|
11
|
Will Carling
|
England
|
1991-1995
|
|
=2nd
|
11
|
Martin Johnson
|
England
|
1999-2003
|
|
=2nd
|
11
|
Raphael Ibanez
|
France
|
2003-2007
|
|
=2nd
|
11
|
John Smit
|
South Africa
|
2003-2007
|
|
=2nd
|
11
|
Sam Warburton
|
Wales
|
2011-2015
|
|
7th
|
10
|
Thierry Dusautoir
|
France
|
2011-2015
|
|
=8th
|
8
|
Agustin Pichot
|
Argentina
|
2003-2007
|
|
=8th
|
8
|
Brian O'Driscoll
|
Ireland
|
2007-2011
|
|
=8th
|
8
|
Semo Sititi
|
Samoa
|
2003-2007
|
(Source: Rugby World Cup Limited)
In joint-second, there are five captains tied on 11 appearances at a Rugby World Cup. England World Cup winner Martin Johnson and his predecessor Will Carling are on the list, as are Raphael Ibanez, John Smit, and Sam Warburton.
Welsh flanker Warburton is an interesting case. Had he not been sent off in the 2011 semi-final, or suffered so terribly with injuries, then he would’ve had a good chance of breaking McCaw’s record.

England and France are the only two nations with more than a single player in the top 10, with each country having two players featured on the list.
Which player has scored the most points at the Rugby World Cup?
Rugby World Cup statistics show that half of the top 10 all-time highest scorers have gone on to win the tournament at least once in their careers.
When combining tries, conversions, penalties, and drop goals, the highest point scorer in Rugby World Cup history is England’s Jonny Wilkinson.
Wilkinson’s kicking was instrumental to the Red Rose’s first Rugby World Cup triumph in 2003, and the fly-half’s overall point count of 277 means he has accumulated at least 22% more points than any other player in Rugby World Cup history.
A breakdown of the 10 players that have scored the most points at the Rugby World Cup
|
Place
|
Points
|
Player
|
Nationality
|
Years
|
|
1st
|
277
|
Jonny Wilkinson
|
England
|
1999-2011
|
|
2nd
|
227
|
Gavin Hastings
|
Scotland
|
1987-1995
|
|
3rd
|
195
|
Michael Lynagh
|
Australia
|
1987-1995
|
|
4th
|
191
|
Dan Carter
|
New Zealand
|
2003-2015
|
|
5th
|
170
|
Grant Fox
|
New Zealand
|
1987-1991
|
|
6th
|
163
|
Andrew Mehrtens
|
New Zealand
|
1995-1999
|
|
7th
|
162
|
Handre Pollard
|
South Africa
|
2015-
|
|
8th
|
140
|
Chris Paterson
|
Scotland
|
1999-2011
|
|
9th
|
136
|
Frederic Michalak
|
France
|
2003-2015
|
|
10th
|
135
|
Gonzalo Quesada
|
Argentina
|
1999-2003
|
(Source: Rugby World Cup Limited)
Wilkinson is followed by another British player, with Scottish fullback Gavin Hastings in second place (227 points). While his overall count is 50 less than fellow kicking master Wilkinson, Hasting’s total is 28 more than the next-highest player and makes him one of only two men to score more than 200 points at the Rugby World Cup.
In third place is Australian fly-half Michael Lynagh. He scored 195 points in his 15 Rugby World Cup appearances, including a critical try against England in the 1991 final. Rounding off the top five are New Zealanders Dan Carter with 191 points and Grant Fox with 170.
The only nations to feature more than one player in the top 10 are New Zealand (three) and Scotland (two). Combined, the All Blacks’ three players (Dan Carter, Grant Fox, and Andrew Mehrtens) have scored 524 points at the Rugby World Cup.
Which player has scored the most tries at the Rugby World Cup?
In Rugby Union, the try is the holy grail. Good kickers may help your team slowly build up a points tally, but great try scorers change games. In many people’s eyes, the greatest Rugby World Cup try scorer of them all was Jonah Lomu, and it’s no surprise to find the New Zealand legend sitting in joint-first place.
A breakdown of the 12 players that have scored the most tries at the Rugby World Cup
|
Place
|
Tries
|
Player
|
Nationality
|
Years
|
|
=1st
|
15
|
Jonah Lomu
|
New Zealand
|
1995-1999
|
|
=1st
|
15
|
Bryan Habana
|
South Africa
|
2007-2015
|
|
3rd
|
14
|
Drew Mitchell
|
Australia
|
2007-2015
|
|
4th
|
13
|
Doug Howlett
|
New Zealand
|
2003-2007
|
|
5th
|
12
|
Adam Ashley-Cooper
|
Australia
|
2007-2019
|
|
=6th
|
11
|
Vincent Clerc
|
France
|
2007-2011
|
|
=6th
|
11
|
Joe Rokocoko
|
New Zealand
|
2003-2007
|
|
=6th
|
11
|
Rory Underwood
|
England
|
1987-1995
|
|
=6th
|
11
|
Chris Latham
|
Australia
|
1999-2007
|
|
=10th
|
10
|
Brian Lima
|
Samoa
|
1991-2007
|
|
=10th
|
10
|
Shane Williams
|
Wales
|
2003-2011
|
|
=10th
|
10
|
David Campese
|
Australia
|
1987-1995
|
(Source: Rugby World Cup Limited)
Lomu’s tally of 15 tries in just two World Cups was unprecedented at the time. The winger burst onto the scene in the 1995 Rugby World Cup when he scored seven tries in just five games. His imperious display against England in the semi-final, when he scored four tries in a single game, is still considered by many to be the greatest performance by a single player in an international rugby match.

Joining Lomu at the top of the table is Bryan Habana, the undisputed star of South Africa’s 2007 World Cup triumph. In that tournament, the Springboks winger scored eight tries, including two in the crucial semi-final victory against Argentina. Habana would go on to play in a further two World Cups, notching up another seven tries.
Lower down the pack, we have Drew Mitchell of Australia, who has scored 14 tries, followed by Doug Howlett of New Zealand in fourth with 13. The only nations to have more than one player score 10 or more tries are Australia and New Zealand, with four and three, respectively.
Which player has scored the most conversions at the Rugby World Cup?
Teams who go on to lift the Rugby World Cup almost always have an ice-cool kicker in their ranks. Nobody optimises this more than New Zealand fly-half Dan Carter, whose total tally of 58 conversions stands head and shoulders above any other player.
A breakdown of the 10 players with the most conversions at the Rugby World Cup
|
Place
|
Conversions
|
Player
|
Nationality
|
Years
|
|
1st
|
58
|
Dan Carter
|
New Zealand
|
2003-2015
|
|
2nd
|
39
|
Gavin Hastings
|
Scotland
|
1987-1995
|
|
3rd
|
37
|
Grant Fox
|
New Zealand
|
1987-1991
|
|
4th
|
36
|
Michael Lynagh
|
Australia
|
1987-1995
|
|
5th
|
28
|
Jonny Wilkinson
|
England
|
1999-2011
|
|
=6th
|
27
|
Paul Grayson
|
England
|
1999-2003
|
|
=6th
|
27
|
Stephen Jones
|
Wales
|
1999-2011
|
|
8th
|
25
|
Andrew Mehrtens
|
New Zealand
|
1995-1999
|
|
9th
|
24
|
Ronan O'Gara
|
Ireland
|
2003-2011
|
|
10th
|
24
|
Frederic Michalak
|
France
|
2003-2015
|
(Source: Rugby World Cup Limited)
Carter made his debut for the All Blacks in 2003 and would go on to represent his nation at four Rugby World Cups, including two consecutive triumphs in 2011 and 2015. His record of 58 conversions is 19 (+49%) more than the next-highest player and more than double the total of England’s 2003 Rugby World Cup hero, Johnny Wilkinson (28).

Before Carter came along, Gavin Hastings of Scotland had the most impressive conversion tally. In his three Rugby World Cups, Hastings kicked 39 successful conversions as part of a Scotland team that reached two quarter-finals and a semi-final.
The rest of the top five is made up of Grant Fox, Michael Lynagh, and Jonny Wilkinson, who scored 37, 36, and 28 conversions, respectively.
New Zealand was the nation responsible for the most players in the top 10, with their three players (Dan Carter, Mike Lynagh, and Andrew Mehrtens) scoring a combined total of 120 conversions at the Rugby World Cup.
Which player has scored the most penalties at the Rugby World Cup?
Of all the players to compete in the Rugby World Cup, nobody has scored as many penalties as Jonny Wilkinson. The England fly-half scored 58 points in his four World Cups between 1999 and 2011 – 48% more than any other player in the game’s history.
The England talisman is perhaps best remembered for his drop-goal prowess, but Wilkinson was just as threatening with the ball on the tee, as proven by the four penalties he scored in the 2003 final victory against Australia.
A breakdown of the top 10 penalty scorers in Rugby World Cup history
|
Place
|
Penalties
|
Player
|
Nationality
|
Years
|
|
1st
|
58
|
Jonny Wilkinson
|
England
|
1999-2011
|
|
2nd
|
39
|
Handre Pollard
|
South Africa
|
2015-present
|
|
3rd
|
36
|
Gavin Hastings
|
Scotland
|
1987-1995
|
|
4th
|
35
|
Gonzalo Quesada
|
Argentina
|
1999-2003
|
|
=5th
|
33
|
Michael Lynagh
|
Australia
|
1987-1995
|
|
=5th
|
33
|
Andrew Mehrtens
|
New Zealand
|
1995-1999
|
|
7th
|
31
|
Grant Fox
|
New Zealand
|
1987-1991
|
|
8th
|
30
|
Thierry Lacroix
|
France
|
1991-1995
|
|
9th
|
27
|
Chris Paterson
|
Scotland
|
1999-2011
|
|
10th
|
26
|
Nicky Little
|
Fiji
|
1999-2011
|
(Source: Rugby World Cup Limited)
A fair way behind Wilkinson on 39 points is Handre Pollard. The South African made his Rugby World Cup debut in 2015, aged just 21, but he really earned his stripes in the 2019 Rugby World Cup in Japan.

Pollard was South Africa’s top point scorer in 2019 as the Springboks lifted the trophy in Japan, scoring 16 penalties in the process. With more World Cups likely to occur in his career, there’s at least some chance that Pollard could one day lay claim to Wilkinson’s impressive record.
The remainder of the top five is made of Gavin Hastings (36), Gonzalo Quesada (35), and Michael Lynagh (33).
New Zealand and Scotland are the only nations with more than one penalty taker in the top 10, with each nation responsible for two players.
Which player has scored the most drop goals at the Rugby World Cup?
There is nobody more synonymous with drop goals at the Rugby World Cup than Johnny Wilkinson. The England fly-half produced the most iconic moment both of his career and his nation's rugby history, with his victory-clinching drop goal in the dying seconds of the 2003 final against Australia.
With 14 drop goals over four competitions, Wilkinson is the undisputed king of drop goals at the Rugby World Cup–the former Newcastle Falcons star has scored more than double the total of any other player.
A breakdown of the players with the most drop goals at the Rugby World Cup
|
Place
|
Drop goals
|
Player
|
Nationality
|
Years
|
|
1st
|
14
|
Jonny Wilkinson
|
England
|
1999-2011
|
|
2nd
|
6
|
Jannie de Beer
|
South Africa
|
1999
|
|
=3rd
|
5
|
Gareth Rees
|
Canada
|
1987-1999
|
|
=3rd
|
5
|
Rob Andrew
|
England
|
1987-1995
|
|
5th
|
4
|
Juan Martin Hernandez
|
Argentina
|
2003-2015
|
|
=6th
|
3
|
Dan Carter
|
New Zealand
|
2003-2015
|
|
=6th
|
3
|
Berrick Barnes
|
Australia
|
2007-2011
|
|
=6th
|
3
|
Dan Parks
|
Scotland
|
2007-2011
|
|
=6th
|
3
|
Jonathan Davies
|
Wales
|
2011-present
|
|
=6th
|
3
|
Gregor Townsend
|
Scotland
|
1999-2003
|
|
=6th
|
3
|
Andrew Mehrtens
|
New Zealand
|
1995-1999
|
|
=6th
|
3
|
Joel Stransky
|
South Africa
|
1995
|
|
=6th
|
3
|
Theuns Kotze
|
Namibia
|
2011-2015
|
|
=6th
|
3
|
Handre Pollard
|
South Africa
|
2015-present
|
(Source: Rugby World Cup Limited)
The next best drop goal kicker in World Cup history is Jannie de Beer–a player who featured in just one Rugby World Cup in 1999. As part of the Springboks squad that lost in the semi-finals, de Beer was able to kick six drop goals in his solitary campaign, including five in a famous quarter-final victory against England.

Other players who make the top 10 are Canadian Gareth Rees and England’s Rob Andrew, who finished joint-third with five drop goals. Argentina fly-half Juan Martin Martinez completes the top five with four, followed by nine players tied on three.
France 2023 Rugby World Cup statistics: What to expect?
Key dates for the France 2023 Rugby World Cup
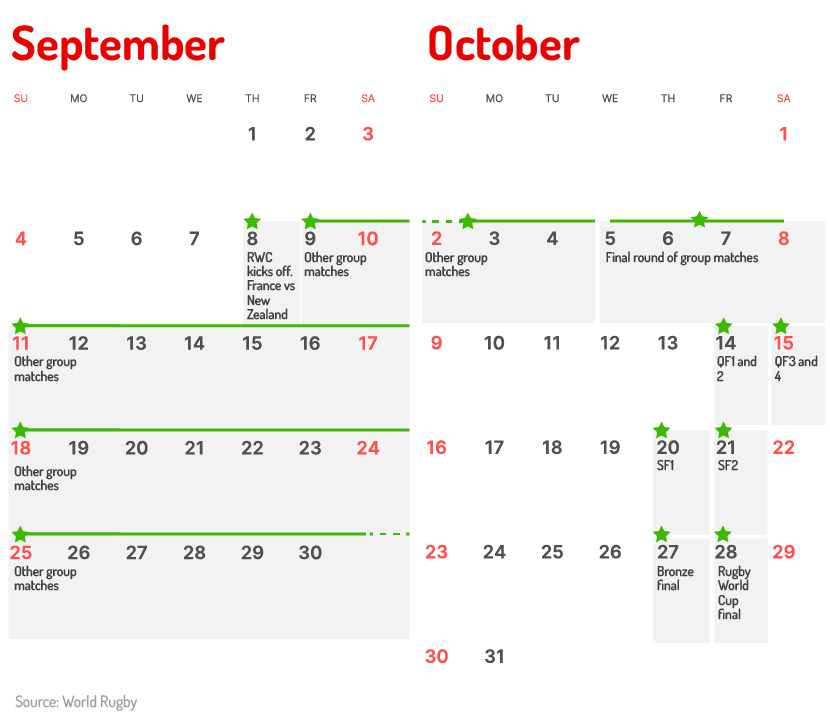
As the 2023 Rugby World Cup approaches, some key dates for your diary are:
- 8 September 2023: Start of the Rugby World Cup, as France takes on New Zealand at the Stade de France.
- 9 September: Other group matches take place up until 8 October.
- 5-8 October: Final round of group matches. This is often when the most exciting games of the group stage take place, as teams vie for a place in the knockout stages. We’ve seen some classics over the years, such as when Scotland went toe-to-toe with Samoa in 2015 or when Fiji shocked Wales with a 38-34 victory to knock them out of the tournament.
- 14 October: First two quarter-final matches (Groups A and B).
- 15 October: Second two quarter-final matches (Groups C and D).
- 20 October: First semi-final match (winner QF1 vs winner QF2)
- 21 October: Second semi-final match (winner QF3 vs winner QF4)
- 27 October: Bronze final (runner-up SF1 vs runner-up SF2)
- 28 October: Rugby World Cup final (winner SF1 vs winner SF2)
France 2023 Rugby World Cup group stage fixture list
The 2023 Rugby World Cup kicks off on Friday, 8 September at 21:15 local time (20:15 GMT) when hosts France take on the mighty New Zealand at the Stade de France in Saint-Denis.
Pipped to be one of the games of the group, this match will see a second take on third in the 2023 world rankings, followed by Italy vs Namibia on Saturday, 9 September at 13:00 local time (12:00 GMT).
All four home nations are in action over the weekend with:
- Ireland vs Romania (9 September at 15:30 local time).
- England vs Argentina (9 September at 21:00 local time).
- South Africa vs Scotland (10 September at 17:45 local time).
- Wales vs Fiji (10 September at 21:00 local time).
A breakdown of France 2023 Rugby World Cup fixtures by day, date, time, fixture, stage, and stadium
|
Day and date
|
Local time (UK time)
|
Fixture
|
Stage
|
Stadium
|
|
Friday 8 September
|
21:15 (20:15)
|
France vs New Zealand
|
Pool A
|
Stade de France, Saint-Denis
|
|
Saturday 9 September
|
13:00 (12:00)
|
Italy vs Namibia
|
Pool A
|
Stade Geoffroy-Guichard, Saint-Etienne
|
|
Saturday 9 September
|
15:30 (14:30)
|
Ireland vs Romania
|
Pool B
|
Stade de Bordeaux, Bordeaux
|
|
Saturday 9 September
|
18:00 (17:00)
|
Australia vs Georgia
|
Pool C
|
Stade de France, Saint-Denis
|
|
Saturday 9 September
|
21:00 (20:00)
|
England vs Argentina
|
Pool D
|
Stade de Marseille, Marseille
|
|
Sunday 10 September
|
13:00 (12:00)
|
Japan vs Chile
|
Pool D
|
Stadium de Toulouse, Toulouse
|
|
Sunday 10 September
|
17:45 (16:45)
|
South Africa vs Scotland
|
Pool B
|
Stade de Marseille, Marseille
|
|
Sunday 10 September
|
21:00 (20:00)
|
Wales vs Fiji
|
Pool C
|
Stade de Bordeaux, Bordeaux
|
|
Thursday 14 September
|
21:00 (20:00)
|
France vs Uruguay
|
Pool A
|
Stade Pierre-Mauroy, Lille
|
|
Friday 15 September
|
21:00 (20:00)
|
New Zealand vs Namibia
|
Pool A
|
Stadium de Toulouse, Toulouse
|
|
Saturday 16 September
|
15:00 (14:00)
|
Samoa vs Chile
|
Pool D
|
Stade de Bordeaux, Bordeaux
|
|
Saturday 16 September
|
17:45 (16:45)
|
Wales vs Portugal
|
Pool C
|
Stade de Nice, Nice
|
|
Saturday 16 September
|
21:00 (20:00)
|
Ireland vs Tonga
|
Pool B
|
Stade de la Beaujoire, Nantes
|
|
Sunday 17 September
|
15:00 (14:00)
|
South Africa vs Romania
|
Pool B
|
Stade de Bordeaux, Bordeaux
|
|
Sunday 17 September
|
17:45 (16:45)
|
Australia vs Fiji
|
Pool C
|
Stade Geoffroy-Guichard, Saint-Etienne
|
|
Sunday 17 September
|
21:00 (20:00)
|
England vs Japan
|
Pool D
|
Stade de Nice, Nice
|
|
Wednesday 20 September
|
17:45 (16:45)
|
Italy vs Uruguay
|
Pool A
|
Stade de Nice, Nice
|
|
Thursday 21 September
|
21:00 (20:00)
|
France vs Namibia
|
Pool A
|
Stade de Marseille, Marseille
|
|
Friday 22 September
|
17:45 (16:45)
|
Argentina vs Samoa
|
Pool D
|
Stade Geoffroy-Guichard, Saint-Etienne
|
|
Saturday 23 September
|
14:00 (13:00)
|
Georgia vs Portugal
|
Pool C
|
Stadium de Toulouse, Toulouse
|
|
Saturday 23 September
|
17:45 (16:45)
|
England vs Chile
|
Pool D
|
Stade Pierre-Mauroy, Lille
|
|
Saturday 23 September
|
21:00 (20:00)
|
South Africa vs Ireland
|
Pool B
|
Stade de France, Saint-Denis
|
|
Sunday 24 September
|
17:45 (16:45)
|
Scotland vs Tonga
|
Pool B
|
Stade de Nice, Nice
|
|
Sunday 24 September
|
21:00 (20:00)
|
Wales vs Australia
|
Pool C
|
OL Stadium, Lyon
|
|
Wednesday 27 September
|
17:45 (16:45)
|
Uruguay vs Namibia
|
Pool A
|
OL Stadium, Lyon
|
|
Thursday 28 September
|
21:00 (20:00)
|
Japan vs Samoa
|
Pool D
|
Stadium de Toulouse, Toulouse
|
|
Friday 29 September
|
21:00 (20:00)
|
New Zealand vs Italy
|
Pool A
|
OL Stadium, Lyon
|
|
Saturday 30 September
|
15:00 (14:00)
|
Argentina vs Chile
|
Pool D
|
Stade de la Beaujoire, Nantes
|
|
Saturday 30 September
|
17:45 (16:45)
|
Fiji vs Georgia
|
Pool C
|
Stade de Bordeaux, Bordeaux
|
|
Saturday 30 September
|
21:00 (20:00)
|
Scotland vs Romania
|
Pool B
|
Stade Pierre-Mauroy, Lille
|
|
Sunday 1 October
|
17:45 (16:45)
|
Australia vs Portugal
|
Pool C
|
Stade Geoffroy-Guichard, Saint-Etienne
|
|
Sunday 1 October
|
21:00 (20:00)
|
South Africa vs Tonga
|
Pool B
|
Stade de Marseille, Marseille
|
|
Thursday 5 October
|
21:00 (20:00)
|
New Zealand vs Uruguay
|
Pool A
|
OL Stadium, Lyon
|
|
Friday 6 October
|
21:00 (20:00)
|
France vs Italy
|
Pool A
|
OL Stadium, Lyon
|
|
Saturday 7 October
|
15:00 (14:00)
|
Wales vs Georgia
|
Pool C
|
Stade de la Beaujoire, Nantes
|
|
Saturday 7 October
|
17:45 (16:45)
|
England vs Samoa
|
Pool D
|
Stade Pierre-Mauroy, Lille
|
|
Saturday 7 October
|
21:00 (20:00)
|
Ireland vs Scotland
|
Pool B
|
Stade de France, Saint-Denis
|
|
Sunday 8 October
|
13:00 (12:00)
|
Japan vs Argentina
|
Pool D
|
Stade de la Beaujoire, Nantes
|
|
Sunday 8 October
|
17:45 (16:45)
|
Tonga vs Romania
|
Pool B
|
Stade Pierre-Mauroy, Lille
|
|
Sunday 8 October
|
21:00 (20:00)
|
Fiji vs Portugal
|
Pool C
|
Stadium de Toulouse, Toulouse
|
(Source: World Rugby)
France 2023 Rugby World Cup knockout stage fixture list
Once teams have progressed from the group stage of the tournament, they will be pitted against each other in a series of head-to-head knockout matches until one team is crowned Rugby World Cup champion.
Each phase of the knockouts will be played over different days and times:
- Quarter-finals are scheduled for the weekend of 14 and 15 October at 17:00 and 21:00 local time.
- Semi-finals will be played over two days (Friday, 20 October, and Saturday, 21 October) at 21:00 local time.
- The bronze final will take place on Friday, 27 October, at 21:00 local time.
- The final is set for Saturday, 28 October, at 21:00 local time.
Once the quarter-final stage has been surpassed, all remaining fixtures will be played at the Stade de France in Saint-Denis, where the tournament commenced seven weeks earlier.
A breakdown of France 2023 Rugby World Cup fixtures by day, date, time, fixture, stage, and stadium
|
Day and date
|
Local time (UK time)
|
Fixture
|
Stage
|
Stadium
|
|
Saturday 14 October
|
17:00 (16:00)
|
Winner Pool C vs Runner-up Pool D
|
Quarter-final 1
|
Stade de Marseille, Marseille
|
|
Saturday 14 October
|
21:00 (20:00)
|
Winner Pool B vs Runner-up Pool A
|
Quarter-final 2
|
Stade de France, Saint-Denis
|
|
Sunday 15 October
|
17:00 (16:00)
|
Winner Pool D vs Runner-up Pool C
|
Quarter-final 3
|
Stade de Marseille, Marseille
|
|
Sunday 15 October
|
21:00 (20:00)
|
Winner Pool A vs Runner-up Pool B
|
Quarter-final 4
|
Stade de France, Saint-Denis
|
|
Friday 20 October
|
21:00 (20:00)
|
Winner QF1 vs Winner QF2
|
Semi-final 1
|
Stade de France, Saint-Denis
|
|
Saturday 21 October
|
21:00 (20:00)
|
Winner QF3 vs Winner QF4
|
Semi-final 2
|
Stade de France, Saint-Denis
|
|
Friday 27 October
|
21:00 (20:00)
|
Runner-up SF1 vs Runner-up SF2
|
Bronze final
|
Stade de France, Saint-Denis
|
|
Saturday 28 October
|
21:00 (20:00)
|
Winner SF1 vs Winner SF2
|
Final
|
Stade de France, Saint-Denis
|
(Source: World Rugby)
Rugby world rankings
Prior to the draw for the 2023 Rugby World Cup, each competing side would have been seeded based on their world rankings at that moment in time. Those with the highest ranking were placed in seed one, down to those ranked lowest in seed four.
A breakdown of rugby world rankings between 2020 and 2023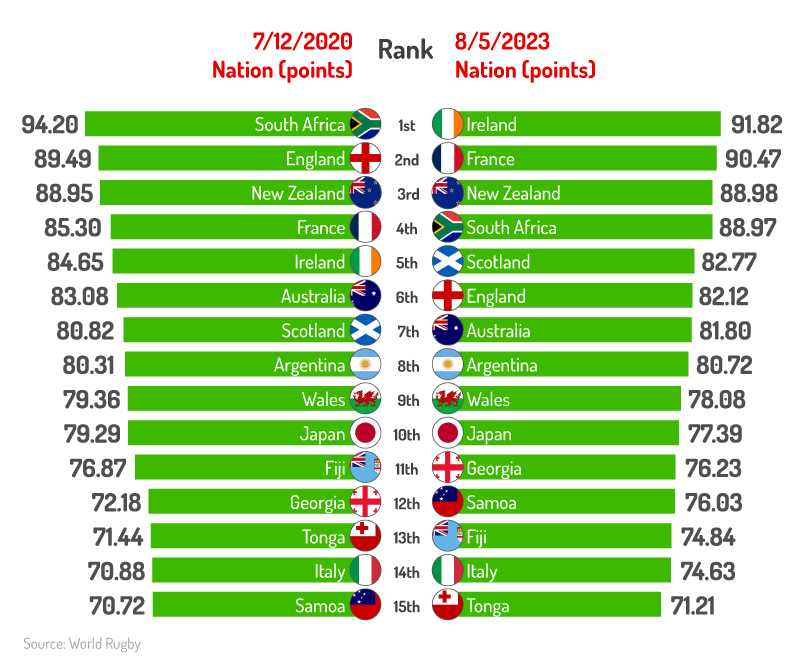
Some nations benefited from the early draw back in December 2020. England, for example, was ranked second in the world at the time with 89.49 points and was seeded in the first group for the 2023 Rugby World Cup. However, by May 2023, they had dropped to sixth with 82.12 points. Similarly, South Africa (world number one in 2020 with over 94 points) had plummeted to fourth in 2023 with less than 89.
On the other hand, Ireland was ranked fifth in world rugby in 2020 but has since risen to number one in the world in 2023, with 91.82 points. Similarly, France has gone from fourth to second between 2020-23 (85.30 vs 90.47 points, respectively).
The vast majority of nations in the top 15 world rankings have either stayed in the same position between 2020-23 or made small movements up/down the rankings. Samoa have jumped from 15th to 12th in the last three years, with Fiji and Tonga have both dropped two places to 13th and 15th, respectively, in 2023.
In May 2023, the qualifying nations for the 2023 Rugby World Cup that are placed outside of the world’s top 15 are:
- Portugal (16th)
- Uruguay (17th)
- Romania (19th)
- Namibia (21st)
- Chile (22nd).
As of 8 May 2023, Chile will be the lowest-ranked team at the 2023 Rugby World Cup, having narrowly defeated the USA 52-51 in a thrilling play-off match to reach the finals for the first time in their history. Back on 7 December 2020 (a week before the draw was made), Chile was ranked a lowly 29th in the world of rugby–surprisingly beating a USA team that was 13 places above them in the world rankings.
The USA and Spain (ranked 18th and 20th, respectively, in May 2023) both failed to qualify for the 2023 Rugby World Cup and, therefore, will not feature in this year’s tournament.
France 2023 Rugby World Cup draw
The draw for the 2023 Rugby World Cup took place on 14 December 2020, almost three years from the start of the tournament.
A breakdown of the 2023 Rugby World Cup draw and the teams in each pool
|
Pool A
|
Pool B
|
Pool C
|
Pool D
|
|
New Zealand
|
South Africa
|
Wales
|
England
|
|
France
|
Ireland
|
Australia
|
Japan
|
|
Italy
|
Scotland
|
Fiji
|
Argentina
|
|
Uruguay
|
Tonga
|
Georgia
|
Samoa
|
|
Namibia
|
Romania
|
Portugal
|
Chile
|
(Source: World Rugby)
2023 Rugby World Cup Pool A
Pool A for the 2023 Rugby World Cup features two of the tournament’s favourites in New Zealand and France, as well as an improving Italy side and a couple of underdogs in the world of international rugby (Uruguay and Namibia).
New Zealand
After a disappointing end to the 2019 Rugby World Cup, New Zealand has since gone on to win the 2020 Tri-Nations, and the Rugby Championship in 2021 and 2022. There are concerns that their record against Northern Hemisphere teams is not what it used to be. In 2021, they uncharacteristically lost 32-22 to Ireland and 40-25 to France, whilst in 2022 they could only muster a 25-25 draw against an out-of-sorts England side.
 France
Hosts France are considered the more likely of the two to top the group. In 2021, France won their first Six Nations title in over 10 years, recording a Grand Slam in the process. They came close to repeating this in 2022 but were pipped to the title by a resurgent Ireland. However, their previous track record in Rugby World Cups is far less successful. Having competed in every tournament since 1987, they’ve always managed to surpass the group stage but are yet to make it past the quarter-finals.
 Italy
Italy
Italy are certainly a better side compared to 2019, but it’ll be a tough ask for them to cause an upset against France or New Zealand. They have never progressed past the group stages in their previous nine appearances at a Rugby World Cup, winning just 13 of their 31 matches.
 Uruguay
Uruguay has only won three of their previous 15 matches in their Rugby World Cup history, scoring a cumulative 188 points to 718 across their previous four appearances in the tournament.
 Namibia
Namibia made their first appearance at the Rugby World Cup in 1999 and qualified for the following five tournaments. However, they have lost all 22 matches in which they have competed. Namibia’s first ever point at a Rugby World Cup came against Canada in 2019, when the match was cancelled due to Typhoon Hagibis and the match was awarded as a 0-0 draw.
2023 Rugby World Cup Pool B
Pool B at the 2023 Rugby World Cup sees two of the game’s heavyweights (Ireland and South Africa) go head-to-head in their quest for world cup success.
 Ireland
Ireland has historically under-performed in World Cups, having never progressed past the quarter-finals. A comprehensive 29-16 victory over England at the Six Nations in 2023 gave the Wolfhounds a much-deserved Grand Slam and Triple Crown in the process. Ranked as number one in the world going into the tournament will certainly make them firm favourites to progress from Pool B and challenge for the final.
South Africa
Defending champions South Africa are three-time winners of the Rugby World Cup. Currently ranked fourth in the world, they will be keen to retain the title, having triumphed over England 32-12 in the 2019 final.
As of 2019, they are the only rugby nation to win in every Rugby World Cup final they have played in. They have won an amazing 83% of their Rugby World Cup matches, scoring an impressive 1,500 points in the process.
 Scotland
Scotland’s best ever finish at a Rugby World Cup came in 1991, when they lost 9-6 in the semi-final to a vaillant England side, followed by a 13-6 defeat to New Zealand in the bronze final to finish fourth. Having progressed in seven out of the nine tournaments they have played in, Scotland will be hopeful of getting out of the group stage (something they failed to achieve in the 2011 and 2019 Rugby World Cups). Having won just over half (57%) of their previous world cup matches, it’s unlikely they will challenge for the title, but will provide a stern challenge for any team who they come up against.
 Tonga
Tonga
Tonga has qualified for every Rugby World Cup, apart from 1991. However, they have never moved beyond the group stage. Tonga’s best performances in a Rugby World Cup came in 2007 and 2011 when they won two of their four group matches. This included a surprise 19-14 victory over eventual finalists France in 2011.
 Romania
Romania played in the first eight Rugby World Cup competitions. They did originally qualify for the 2019 Rugby World Cup but were later disqualified for fielding ineligible players during qualifying. Like Tonga, they have never made it out of the group stage and have only won six of their previous 28 World Cup group matches (21%).
2023 Rugby World Cup Pool C
Pool C at the 2023 Rugby World Cup will see Wales pitted against two-time world champions Australia, as well as established Fiji, an improving Georgia, and outsiders Portugal.
 Wales
Wales
One of the teams to benefit from the early draw was Wales. When the draw took place, Wales was ranked fourth in the world after a sparkling performance at the 2019 Rugby World Cup when they reached the semi-finals. However, going into the 2023 tournament, they have dropped to ninth.
Wales’ best performance came in the inaugural 1987 Rugby World Cup, when they finished third when they won all three pool matches and the quarter-final before losing 49-6 to eventual winners New Zealand. In all, they have won nearly 60% of their matches at a Rugby World Cup, scoring more than 1,200 points in the process.
Australia
Two-time world cup winners Australia have played in all nine tournaments prior to 2023. Victories in 1991 and 1999 make them the third most successful nation of all time in the competition, behind South Africa and New Zealand, who have both won the trophy three times.
Poor performances in 2022, including a 22-20 loss to Italy, has resulted in them dropping to seventh in the world rankings. However, write them off at your peril. The Wallabies have won 80% of their world cup matches since 1987, scoring more than 1,600 points in the process.
 Fiji
Fiji
Fiji has played in all but one of the nine Rugby World Cups to date (1995, when they failed to qualify). Their best finish was jointly in 1987, 1999, and 2007, when they reached the quarter-finals. Having amassed only 732 points and conceded 971 over these eight tournaments, it’s little surprise that Fiji have won just over a third (34%) of the matches they have played in.
 Georgia
Georgia as an independent country did not exist until 1991, when the Soviet Union collapsed.
Having failed to qualify in 1995 and 1999, they finally succeeded in 2003 and have qualified for every tournament since.
Coming off the back of their sixth successive Rugby European International Championship victory, perhaps the 2023 Rugby World Cup will be The Lelos turn to cause an upset on the international rugby stage.
 Portugal
The 2023 Rugby World Cup will be Portugal’s second appearance at the tournament after their appearance in 2007. During the 2007 Rugby World Cup, they lost every match, scoring just 38 points and conceding 209 over the four matches. The team ranked in 16th will certainly be looking to go one better this year, and claim their first ever victory at a whaved cup finals.
2023 Rugby World Cup Pool D
Pool D at the 2023 Rugby World Cup will see England pitted against a number of established rugby nations (Argentina, Japan, and Samoa), as well as outsiders in the shape of Chile.
England
England are a team to have benefited from the early draw. After a dominant spell of titles in 2020, where they won the Six Nations and Autumn Nations Cup, England has since dropped to sixth in the rugby world rankings.
Having played 51 matches and recorded 36 victories since 1987 in the Rugby World Cup, England has won more than 70% of their total matches in the competition. They were crowned world champions in 2003, after Johnny Wilkinson’s iconic last-minute drop goal gave them a dramatic 20-17 victory over Australia in extra time.
The Three Lions will be looking to go one step further in 2023 than they were able to in 2019, when they lost 32-12 to South Africa in the final.
 Japan
Japan
Japan have competed at every Rugby World Cup since 1987 and are the only team to reach the finals through Asian regional qualifying. At the 2019 tournament, they progressed to the quarter-finals for the first time in their participation, making them the first Asian team to do so in the history of the Rugby World Cup.
Having won less than a quarter (24%) of their matches in the world cup to date and accumulating just 644 points to 1347 across nine tournaments, it’s unlikely Japan will cause an upset at the 2023 Rugby World Cup. But, stranger things have happened before.
 Argentina
Football may be the national obsession in Argentina, but the national rugby team is certainly a force to be reckoned with. Semi-finalists in 2007 and 2015, the Pumas are ranked eighth in the world as of 2023, two places below England.
Having narrowly beaten England 30-29 in their last meeting (November 2022), Argentina will be looking to challenge the group favourites and progress to the latter stages of the competition, something they were unable to achieve at the 2019 Rugby World Cup.
 Samoa
Samoa
Samoa has played in every Rugby World Cup since 1991, only missing out on the inaugural competition due to not being invited. Having been eliminated in the quarter-finals at the 1991, 1995, and 1999 competitions, they haven’t been able to progress past the group stage since. This might seem surprising for a team currently ranked twelfth in the world rugby rankings, however, the 2023 Rugby World Cup might be their time to shine.
 Chile
Chile
The 2023 Rugby World Cup will see debutants Chile make their first appearance at the World Cup finals. After a dramatic 52-51 victory over the USA in their final qualifier, the team ranked 22nd in the world of rugby will certainly be the underdogs of the group going into the competition.
2023 Rugby World Cup stadiums overview
A breakdown of the 2023 Rugby World Cup stadiums by location and their capacity
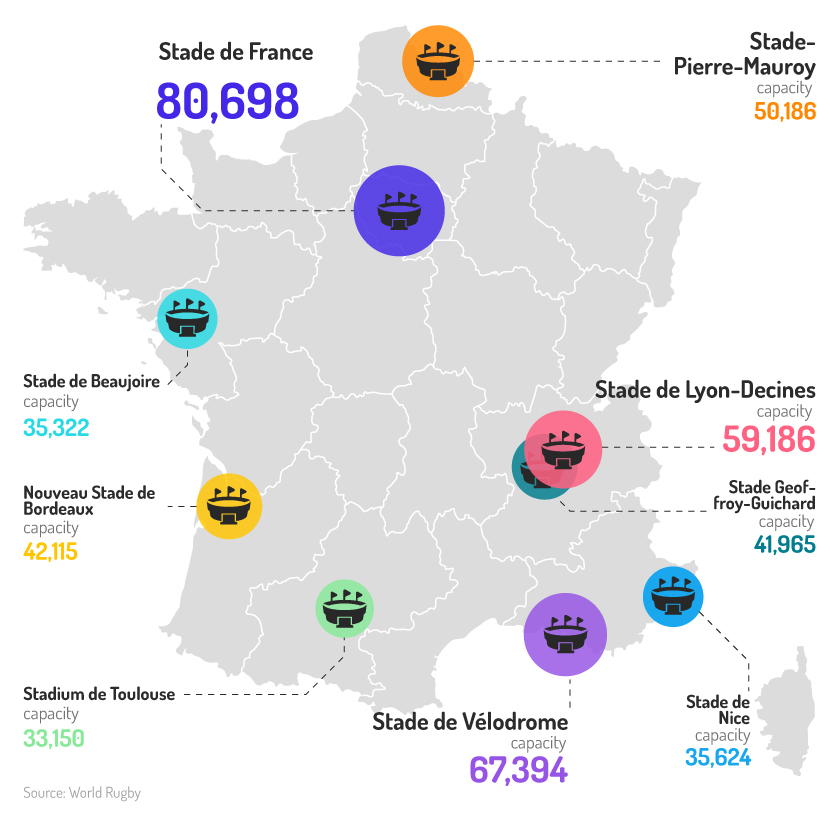
Stade de France, Saint-Denis (capacity 80,698)
With a capacity of almost 80,700, the Stade de France is France’s largest stadium. Located just north of Paris in a suburb called Saint-Denis, the Stade de France opened in 1998 and hosted the 1998 FIFA World Cup final, the 2016 UEFA Euros final, and the 2007 Rugby World Cup final.
2023 Rugby World Cup fixtures
- 8 September - France vs New Zealand - Pool A
- 9 September - Australia vs Georgia - Pool C
- 23 September - South Africa vs Ireland - Pool B
- 7 October - Ireland vs Scotland - Pool B
- 14 October - Winner of Pool B vs Runner-Up of Pool A - Quarter-final
- 15 October - Winner of Pool A vs Runner-Up of Pool B - Quarter-final
- 20 October - Semi-final 1
- 21 October - Semi-final 2
- 27 October - Bronze final
- 28 October - Rugby World Cup final
Marseille, Stade de Vélodrome (capacity 67,394)
As the home ground of football club Olympique Marseille, the Stade de Velodrome is one of France’s most recognisable venues. It also plays host to the occasion Toulon event, as well as French international rugby and football matches
2023 Rugby World Cup fixtures
- 9 September - England vs Argentina - Pool D
- 10 September - South Africa vs Scotland - Pool B
- 21 September - France vs Namibia - Pool A
- 1 October - South Africa vs Tonga - Pool B
- 14 October - Winner of Pool C vs Runner-Up of Pool D - Quarter-final
- 15 October - Winner of Pool D vs Runner-Up of Pool C - Quarter-final
Stade de Lyon-Decines, Lyon (capacity 59,186)
Since its opening in 2016, the Stade de Lyon-Decines has been the home ground of Olympique Lyon FC. It also hosted fixtures in football’s Euro 2016 and the FIFA Women’s World Cup final in 2019.
2023 Rugby World Cup fixtures
- 24 September - Wales vs Australia - Pool C
- 27 September - Uruguay vs Namibia - Pool A
- 29 September - New Zealand vs Italy - Pool A
- 5 October - New Zealand vs Uruguay - Pool A
- 6 October - France vs Italy - Pool A
Stade Pierre-Mauroy, Lille (capacity 50,186)
Home of Lille OSC, the Stade Pierre-Mauroy opened in 2012. It’s named after former mayor and Prime Minister of France, Perre Mauroy, who died in 2013.
2023 Rugby World Cup fixtures
- 14 September - France vs Uruguay - Pool A
- 23 September - England vs Chile - Pool D
- 30 September - Scotland vs Romania - Pool B
- 7 October - England vs Samoa - Pool D
- 8 October - Tonga vs Romania - Pool B
Nouveau Stade de Bordeaux, Bordeaux (capacity 42,115)
Another new build for Euro 2016, the Nouveau Stade de Bordeaux is home to FC Girondins de Bordeaux. The stadium also played host to the knockout phase of the 2015 EuroBasket.
2023 Rugby World Cup fixtures
- 14 September - France vs Uruguay - Pool A
- 23 September - England vs Chile - Pool D
- 30 September - Scotland vs Romania - Pool B
- 7 October - England vs Samoa - Pool D
- 8 October - Tonga vs Romania - Pool B
Stade Geoffroy-Guichard, Saint-Etienne (capacity 41,965)
Initially opened back in 1930, the Stade Geoffroy-Guichard is nicknamed ‘The Cauldron’ because of its fiery atmosphere. The stands are green to match the colours of the home side, AS Saint-Etienne.
2023 Rugby World Cup fixtures
- 9 September - Italy vs Namibia - Pool A
- 17 September - Australia vs Fiji - Pool C
- 22 September - Argentina vs Samoa - Pool D
- 1 October - Australia vs Portugal - Pool C
Stade de Nice (Nice) - capacity 35,624
Seen by many as one of the most picturesque stadiums in the world, the Stade de Nice is a multi-use venue used by OGC Nice and Touloun.
2023 Rugby World Cup fixtures
- 16 September - Wales vs Portugal - Pool C
- 17 September - England vs Japan - Pool D
- 20 September - Italy vs Uruguay - Pool A
- 24 September - Scotland vs Tonga - Pool B
Stade de Beaujoire (Nantes) - capacity 35,322
Opened in 1984, the Stade de Beaujoire hosted fixtures in the 1984 UEFA Euros, 1998 FIFA World Cup, and the 2007 Rugby World Cup.
2023 Rugby World Cup fixtures
- 16 September - Ireland vs Tonga - Pool B
- 30 September - Argentina vs Chile - Pool D
- 7 October - Wales vs Georgia - Pool C
- 8 October - Japan vs Argentina - Pool D
Stadium de Toulouse (Toulouse) - capacity 33,150
With a capacity of just over 33,000, Stadium de Toulouse is the smallest stadium to host fixtures at the 2023 Rugby World Cup. Located on the island of Ramier near the centre of Toulouse, it plays host to home matches for Toulouse FC and Stade Toulousain in the European Rugby Champions Cup or Top 14 competition.
2023 Rugby World Cup fixtures
- 10 September - Japan vs Chile - Pool D
- 15 September - New Zealand vs Namibia - Pool A
- 23 September - Georgia vs Portugal - Pool C
- 28 September - Japan vs Samoa - Pool D
- 8 October - Fiji vs Portugal - Pool C
Rugby World Cup Glossary
Try (rugby definition)
A try is a method in which rugby players score points. To score a try, the player must place the ball on the ground, under his or her full control. Players cannot just throw the ball into the area, as they must remain in contact with the ball at all times. Rugby Union rules show a try is worth 5 points to a team.
Conversion
A conversion is where, once a try has been scored, the team then gets the opportunity for more points. A chosen player places the ball on a line that intersects the try line, and they then must kick the ball through the posts at the end of the pitch. Doing so successfully, the team then gets two additional points.
Scrum
In Rugby Union rules, a scrum is a means of restarting play after some form of minor infringement. Players from each team bind together in three rows, pushing hard against each other. The scrum must be stable, with penalties in due course if the scrum is deemed to have collapsed intentionally. Once the formation is complete, the ball is fed into the middle of the scrum, with teams competing for control of the ball.
Ruck
A ruck is a phase of play in which one or more players from each team close in on the ball. They must remain on their feet and in control. Players who leave the ruck must return back to behind the offside line so as not to interfere with the ruck. For safety, players must keep their head in a good position, with head and shoulders above hips at all times.
Lifting
In rugby tactics, the use of lifting a player on your team increases the chance of that player’s ability to catch and control airborne balls. However, there are rules associated: primarily, the player must be lowered to the floor in a controlled fashion, as opposed to being dropped. This should avoid potential spinal and head injuries in games.
Lineout
It is a way of restarting play after the ball has been knocked or kicked out of play past the touchline. The line-out consists of three to eight players from each side, up to 16 in total, and is taken where the ball went out of play. The aim of each player is to get their hands on the ball for their team, taking control.
Turnover
Simply, a rugby turnover is when the team controlling the ball loses possession, with the other team then taking over. This can come from open play or from scrums and other infringement-derived plays. An example of a turnover can come from counter-rucking the opponent, forcing control cleanly.
Rugby World Cup FAQs
When is the Rugby World Cup 2023?
The 2023 Rugby World Cup will take place between 8 September and the 28 October, in multiple French cities. Within that 51-day period, 48 Rugby World Cup matches will be played in a tournament celebrating the 200-year anniversary of rugby’s inception.
Where is the Rugby World Cup in 2023?
The Rugby World Cup in 2023 will be hosted by France, with the European country using 9 of its top stadiums across the nation. Matches will be played in Bordeaux, Lille, Lyon, Marseille, Nantes, Nice, St Etienne, Saint-Denis, and Toulouse.
When is the Rugby World Cup final in 2023?
The 2023 Rugby World Cup final will be contested on the 28th of October. This important final will be played in the Stade de France, 10 miles north of central Paris, in a city called Saint-Denis. Kick-off is expected to be at 20:00 local time.
Who has the most tries in Rugby World Cup history?
According to Rugby World Cup history statistics, Bryan Habana & Jonah Lomu both have a record 15 tries to their names, representing South Africa and New Zealand, respectively. Australia’s Drew Mitchell is just one behind, having scored 14 Rugby World Cup tries over his career.
What is the biggest rugby stadium?
In terms of the 2023 Rugby World Cup, the Stade de France has the highest potential attendance figure in the competition. The stadium, situated 10 miles north of Paris in a city called Saint-Denis, can host up to 80,000 Rugby World Cup fans. The largest rugby stadium by capacity is the FNB Stadium in Johannesburg, South Africa, with 94,736 seats available to fans.
Has England qualified for all Rugby World Cups?
Since the Rugby World Cup’s inception in 1987, England’s national team has competed in every Cup. The Lions have fought their way to three finals, winning the Rugby World Cup in 2003 in Australia.
Has any team been to every Rugby World Cup?
As revealed by Rugby World Cup history statistics, 11 teams have consistently competed at all nine of the Rugby World Cups in the period of 1987 to 2019. Those nations are New Zealand, Australia, England, France, Wales, Argentina, Scotland, Ireland, Canada, Japan, and Italy. Only three nations have only appeared once: Ivory Coast, Spain, and Portugal.
Sources
https://www.espn.com/rugby/
1987 Rugby World Cup statistics - Wikipedia
1991 Rugby World Cup statistics - Wikipedia
1995 Rugby World Cup statistics - Wikipedia
1999 Rugby World Cup statistics - Wikipedia
2003 Rugby World Cup statistics - Wikipedia
2007 Rugby World Cup statistics - Wikipedia
2011 Rugby World Cup statistics - Wikipedia
2015 Rugby World Cup statistics - Wikipedia
2019 Rugby World Cup statistics - Wikipedia
https://www.rugbyworldcup.com/about/records
https://en.wikipedia.org/wiki/Rugby_World_Cup_all-time_table and https://rugby.statbunker.com/alltimestats/AllTimeLeagueTable?comp_code=8029375
https://www.statsperform.com/resource/revolutionising-rugby-a-statistical-analysis-on-how-the-game-has-evolved/
https://en.wikipedia.org/wiki/Records_and_statistics_of_the_Rugby_World_Cup
https://www.rugbyworldcup.com/2023/visit
https://en.wikipedia.org/wiki/List_of_rugby_union_stadiums_by_capacity
https://www.theguardian.com/media/2011/oct/24/tv-ratings-rugby-world-cup-final
http://en.espn.co.uk/scrum/rugby/story/163342.html
https://www.sportspromedia.com/news/japan-2019-rugby-world-cup-tv-viewership-record/
https://www.world.rugby/tournaments/rankings/mru
https://www.theguardian.com/sport/2020/jun/25/the-breakdown-rugby-union-1987-world-cup-nations-championship
https://www.sportcal.com/pressreleases/itv-gets-second-highest-uk-audience-for-rugby-world-cup-final/